Welcome to FSSE’s public data visualizations. See a variety of aggregate visualizations below, with more to come soon! Click on a button below to begin your exploration of FSSE data.
Institutions now have access to institution-specific dashboards for FSSE administrations from 2014 on to the present. Designated institution contacts can find these dashboards in the Data & Reports Table on the NSSE Institution Interface.
Overviews
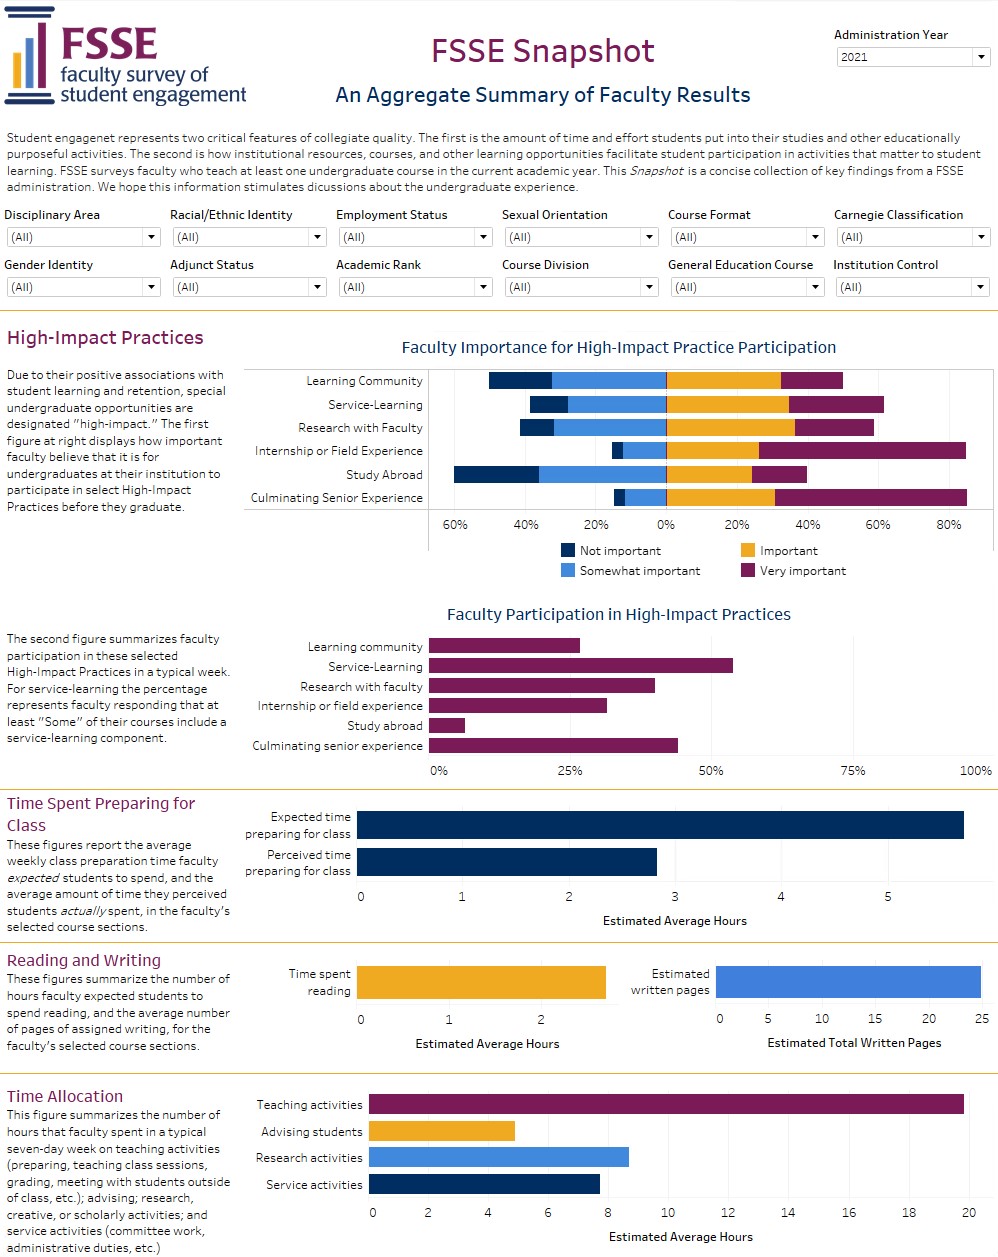
Snapshot
A collection of key findings across the core FSSE survey
Institutions now have access to institution-specific dashboards for FSSE administrations from 2014 on to the present. Designated institution contacts can find these dashboards in the Data & Reports Table on the NSSE Institution Interface.
FSSE is working hard to pave the way for Tableau visualizations with NSSE and BCSSE data. After FSSE has all the bugs worked out, other projects will follow!
We’d love to hear your ideas! Drop us an email at fsse@indiana.edu.
Of course! FSSE staff are more than happy to help. Your questions can help us make the tool easier to use for everyone. Send your questions to fsse@indiana.edu or call us at 812-856-5824.
On the bottom right-hand side of the screen (you may need to scroll down) there are options for downloading your visualization as a PDF or an image.
Please feel free to share this tool with others by linking to our site. On the bottom right-hand side of the screen (you may need to scroll down) there is an option for sharing the link via email.
We’re working on it! Topical Module visualizations are coming soon!
Evidence-Based Improvement in Higher Education resources and social media channels