For this year’s Annual Results, we would like to expand on Felten and Lambert’s (2020) conception of “Relationship-Rich Education” to think about how identities can interact and influence the various relationships students form during their higher education experience.
As student populations are incredibly diverse even within institutions, examining educational quality and student experiences means we must look at subgroups in the data we collect. This work is critical to our understanding of student engagement, allowing us to learn about growing student subpopulations, find areas of inequity, close gaps in achievement, and redefine our conceptualizations of student success. Some aspects of the respondent experience can be relatively easy to capture in a survey question, but others, particularly questions about identity, can be a challenge. Some of these challenges include students' ongoing identity development and exploration, evolving conception and language related to identity, and the potential political and material consequences for certain identity groups. Socioeconomic status, for example, is a broad concept of one’s access to financial, social, cultural, and human capital resources, but it is frequently simplified to questions about first-generation status, family wealth, or eligibility for federal grants.
NSSE staff have invested in continuous improvements to the survey instrument to allow for more inclusive explorations of engagement data. Some examples of complex identity items that have been recently updated are racial/ethnic identification, gender identity, sexual orientation, and reported disabilities or conditions that impact learning, working, or living activities. To be sensitive to the fluid and contextual nature of identity, NSSE respondents can choose multiple components of an aspect of identity. Prioritizing this benefit to respondents, however, can create difficulties for analysis and understanding of the data. These difficulties are a function, and opportunity to push the limits, of traditional strategies for analysis and representation of quantitative data.
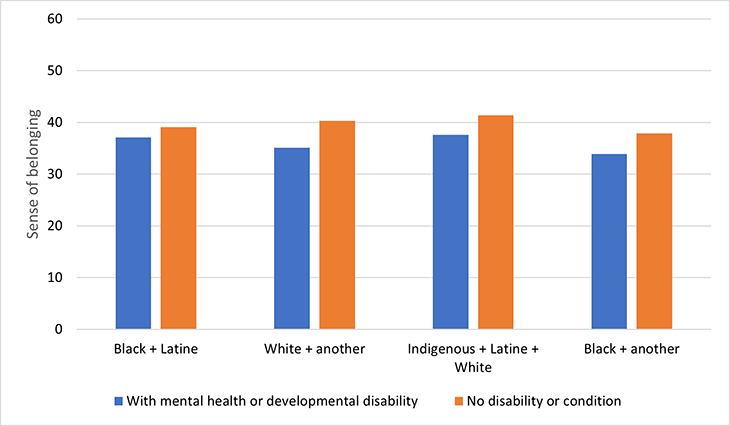
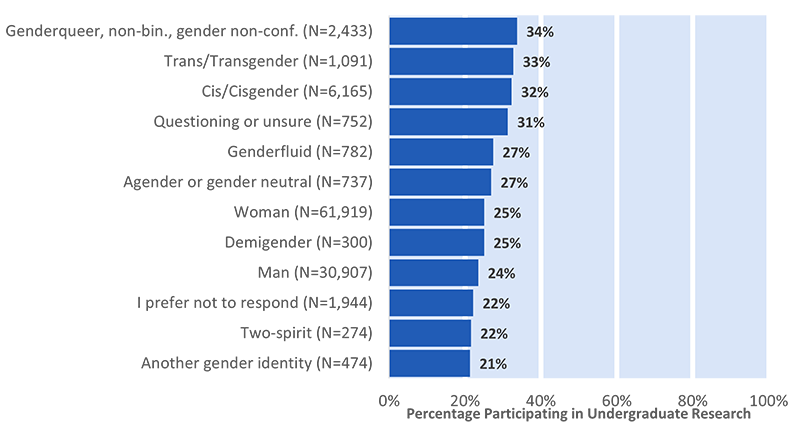
The following vignettes highlight what we can learn from taking advantage of the complexity of this data and digging deeper into traditionally aggregated groups of students. We will first look at what we can learn about relationship-building aspects of engagement for students commonly grouped as bi- or multi-racial when we disaggregate by common combinations of selected racial/ethnic heritage. Next, we will look at sense of belonging for students with differing conditions or disabilities that impact their learning, working, or living activities. Finally, we will combine what we learned in these explorations to further examine belonging for students with intersections of these aspects of identity.