• Skip to Content
  • Skip to Main Navigation
  • Skip to Search

NSSE logo

NSSENSSENSSE

Open Search
  • NSSE
    • About NSSE
      • Conceptual Framework
      • Positions and Policies
      • Advisors
      • Partners
      • Employment
    • Survey Instruments
      • Topical Modules
      • Engagement Indicators
      • High-Impact Practices
    • Registration Details
      • Pricing
      • Campus Contacts
      • Administration Checklist
    • Administering NSSE
      • Population File
      • Customizing NSSE
      • Recruitment Method
        • Folder Name
      • Encouraging Participation
      • Terms of Participation
      • Accessibility
      • Data Security
    • Reports & Data
      • NSSE Administration Overview
      • Data Files
      • Sample Report
      • Institutional Report Guide
      • Report Builder
      • Data Summaries & Interactive Displays
    • Working with NSSE Data
      • Data Codebooks
      • Syntax
    • Psychometric Portfolio
      • Response Rates
    • NSSE Shorts (New)
      • Pricing and Registration
      • Administration Instructions
      • Item Sets
      • Reports & Data
      • Dashboard LogIn
  • FSSE
    • FSSE Portal Log-in
    • NEW Customizable Pathways
    • About FSSE
    • Survey Instruments
      • Content Modules
      • FSSE Scales
      • Disciplinary Areas
      • Consortium Questions
      • FSSE Classic (Pre 2026)
        • Main Survey
        • Topical Modules
    • Registration & Pricing
    • Administering FSSE
      • Administration Overview
      • Confidentiality
      • Customization
        • Preparing for Message Delivery
        • Population File Instructions
      • Data Security
      • IRB Protocol
        • Informed Consent
      • Locating Your Data & Results
      • Sample Reports
        • Administration Summary
        • FSSE Respondent Profile
        • FSSE Topical Module Report
        • FSSE Disciplinary Area Report
        • FSSE-NSSE Combined Report
        • FSSE Frequency Report
        • FSSE Snapshot Report
      • Terms of Participation
    • Findings, Data, & Reports
      • FSSE Overview
      • Content Summaries
      • Data Visualizations
      • Data Use Examples
    • Working with FSSE data
      • Using FSSE Data
      • Analysis Resources
      • Data User's Guide
    • Psychometric Portfolio
  • BCSSE
    • About BCSSE
    • BCSSE Survey
      • BCSSE Scales
    • Fall Check-In
    • Registration & Pricing
    • Administering BCSSE
      • Administration Protocol and Procedures
      • BCSSE Contacts
      • Demonstration Dashboard Portal
      • Institution Participation Agreement
      • IRB
      • Data Security and Accessibility
    • Reports & Data
      • BCSSE Overview
      • Accessing BCSSE Data
      • Summary Tables
    • Working with BCSSE data
      • Additional Resources
    • Dashboard Log-in
  • Support & Resources
    • For Participating Institutions
      • How Institutions Use Their Data
        • Lessons from the Field
          • Institution Examples
        • NSSE Data Use in Brief
        • Search for examples
        • Displaying Results
        • Data Use Teams
      • Data & Results Guides
        • Student Success Mapping
        • Navigating Your Institutional Report
        • Tips for More Inclusive Data Sharing and Analysis
        • Data User's Guide: Sense of Belonging
        • Accreditation Toolkits
        • Sharing and Disseminating NSSE Results
        • NSSE Data User’s Guide
        • Campuswide Mapping
        • Contextualizing NSSE Effect Sizes
        • Custom Analysis
      • Workshops and Webinars
    • For Partnerships
      • Special Projects
    • For Students & Parents
      • Pocket Guide
        • English
        • Spanish
    • For All Audiences
  • Research
    • Annual Results
      • Annual Results 2023
        • Special Report 1
        • Special Report 2
      • Annual Results 2022
        • 1. Rebounding Engagement
        • 2. Digging Deeper Into HIP Quality
        • 3. Hot Topics in Higher Ed
      • Past Annual Results
    • Publications & Presentations
      • Foundational Publications
      • Featured Publications
      • Recent Presentations
      • Lessons from the Field
      • DEEP Practice Briefs
      • Search
    • NSSE Essentials
    • NSSE Sightings (blog)
      • Search Posts
  • Institution Login
  • BLOG
  • Contact Us

Our Research: Projects,
Publications, and More

  • Home
  • NSSE
    • About NSSE
    • Survey Instruments
    • Registration Details
    • Administering NSSE
    • Reports & Data
    • Working with NSSE Data
    • Psychometric Portfolio
    • NSSE Shorts (New)
  • FSSE
    • FSSE Portal Log-in
    • NEW Customizable Pathways
    • About FSSE
    • Survey Instruments
    • Registration & Pricing
    • Administering FSSE
    • Findings, Data, & Reports
    • Working with FSSE data
    • Psychometric Portfolio
  • BCSSE
    • About BCSSE
    • BCSSE Survey
    • Fall Check-In
    • Registration & Pricing
    • Administering BCSSE
    • Reports & Data
    • Working with BCSSE data
    • Dashboard Log-in
  • Support & Resources
    • For Participating Institutions
    • For Partnerships
    • For Students & Parents
    • For All Audiences
  • Research
    • Annual Results
    • Publications & Presentations
    • NSSE Essentials
    • NSSE Sightings (blog)
  • Search
  • Institution Login
  • BLOG
  • Contact Us
  • Home
  • Research
  • NSSE Sightings (blog)

Assessment Data Asterisk: What Can NSSE Campuses Learn from Spring 2020 Results?

Jillian Kinzie

Thursday, June 25, 2020

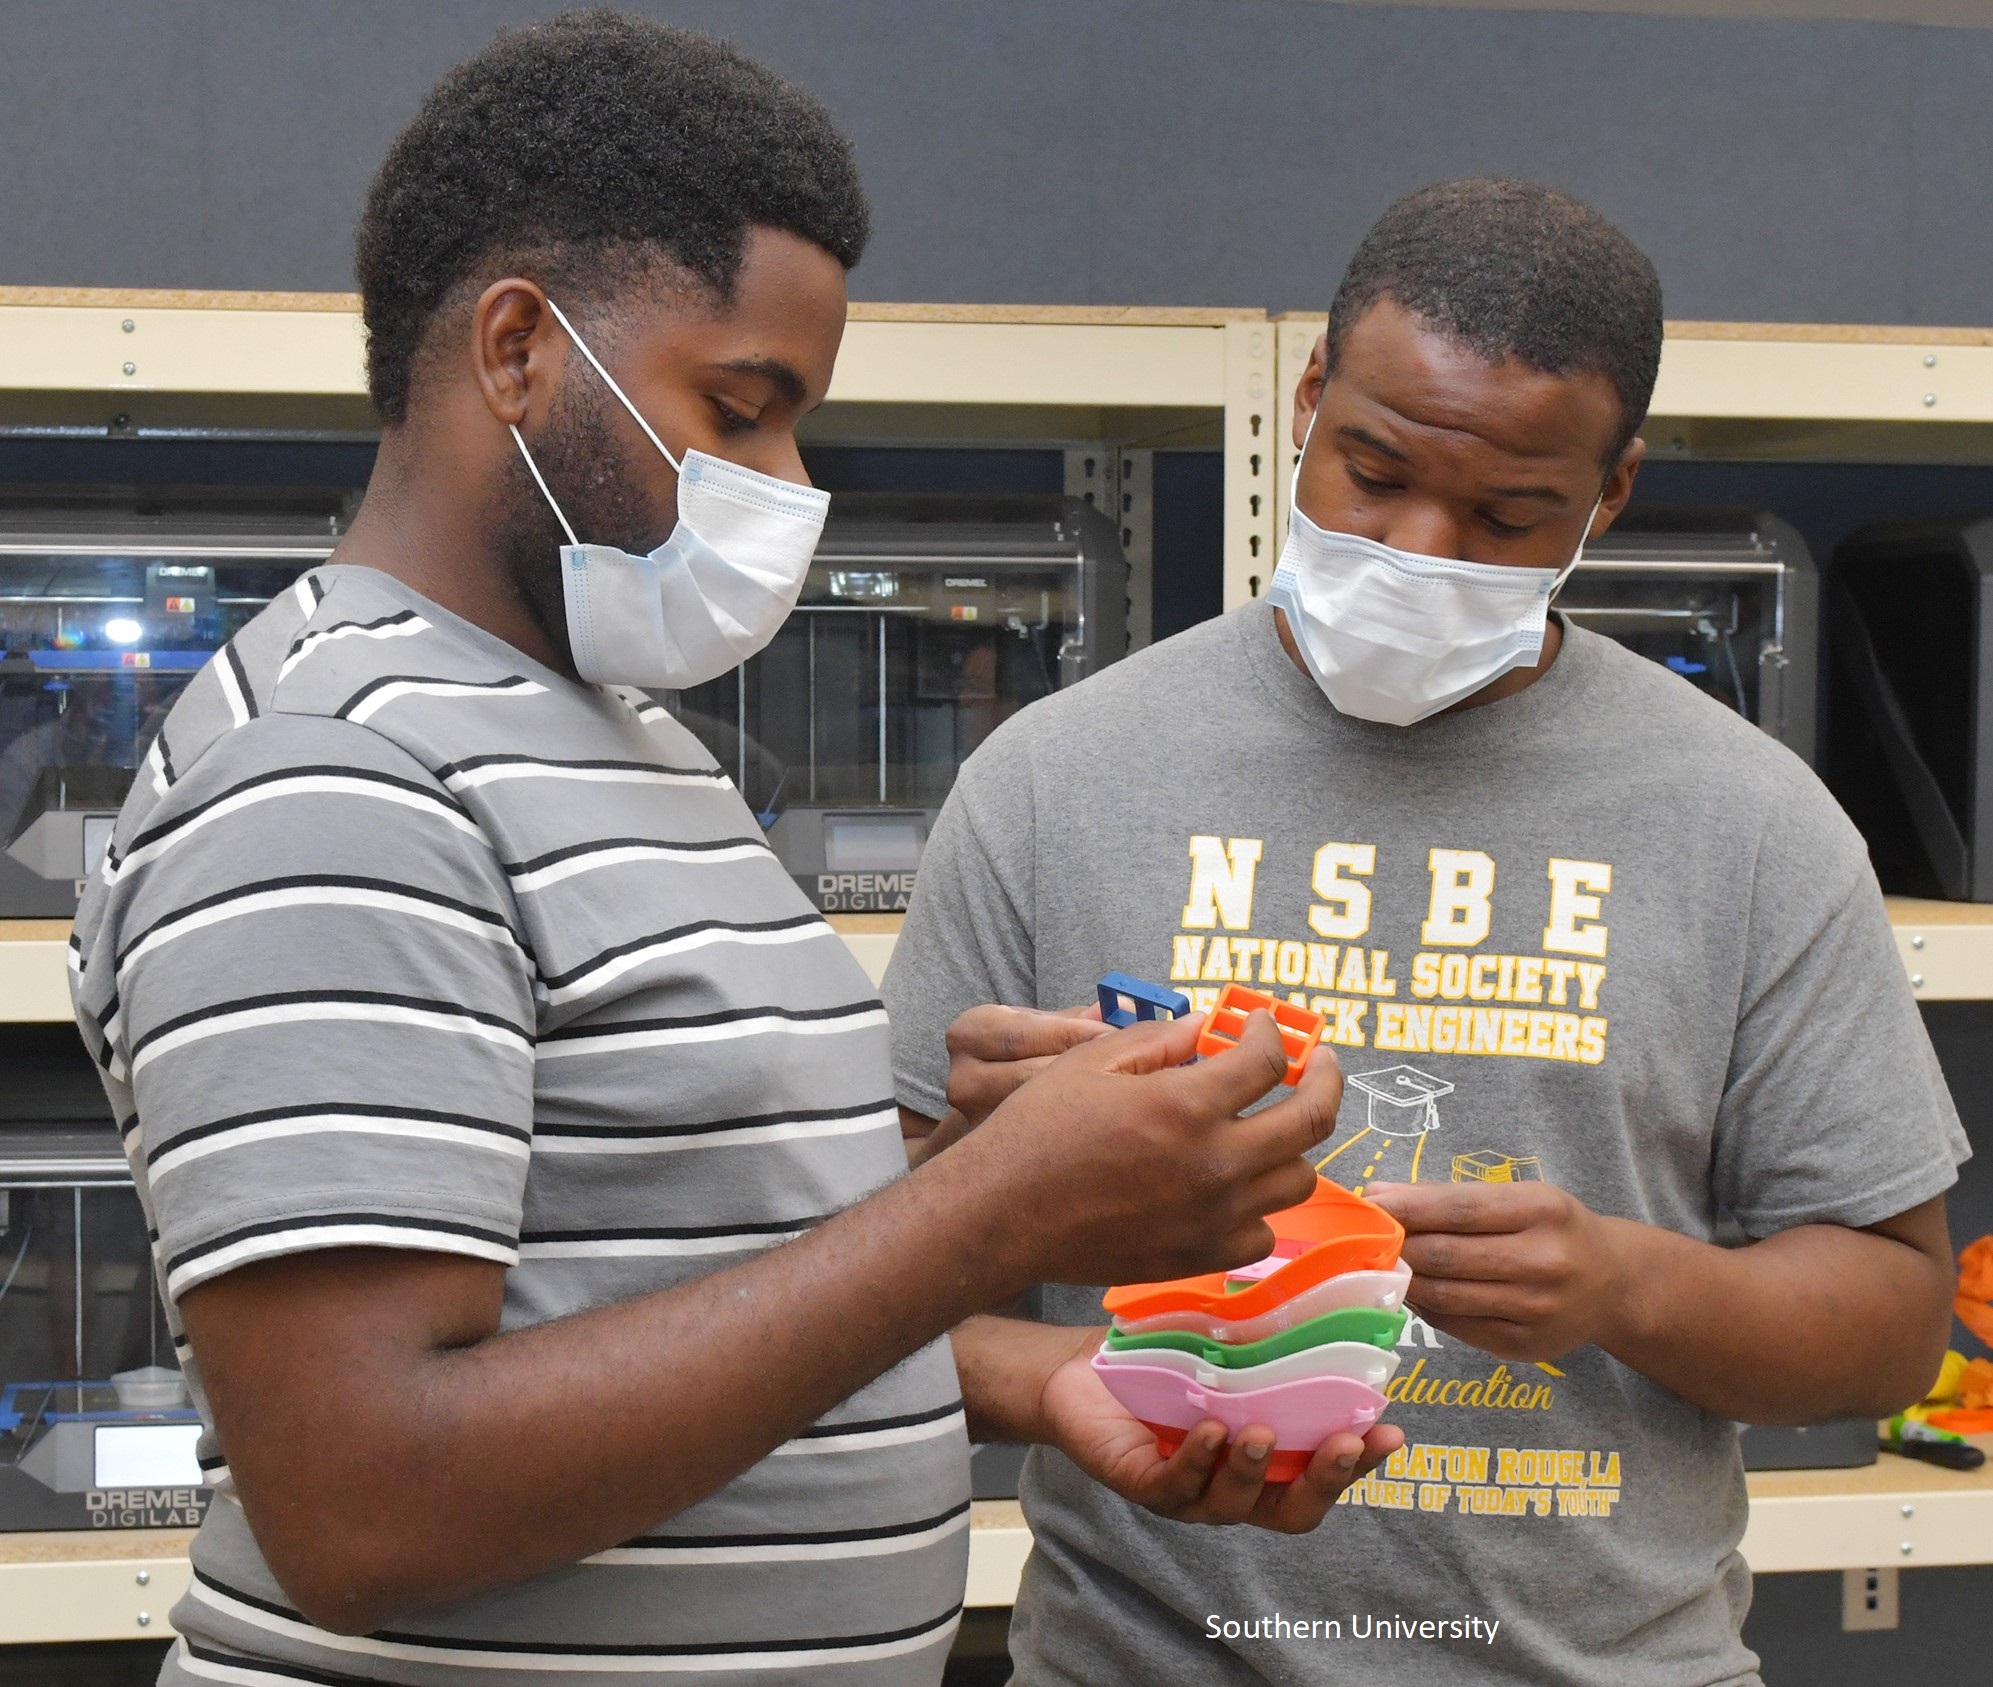
Photo courtesy of Southern University

The Spring 2020 disruption caused by the coronavirus affected every aspect of undergraduate education, including our best laid assessment plans. Rapidly changed circumstances prompted the addition of an asterisk to information associated with the spring term, including semester grade records, end of course evaluations, licensure exam scores, and assessment data, among others. Adding lengthy, descriptive footnotes to reports and files is important for good data documentation.

Although the COVID-19 footnote should explain our extremely changed circumstances, it would be a mistake to consider information collected during this period unusable, incomparable, or simply a break in the trend line. Rather, information should be examined for what the disruption revealed about our institutions or in our students' learning experiences and how this information could be used to inform educational design moving forward.

NSSE 2020 data provide particular insights from pre- and post-coronavirus disruption respondents. While the majority of colleges and universities participating in NSSE 2020 had most of their student responses recorded prior to the disruption, some students responded after the disruption, and institutions with late administration schedules are realizing more post-disruption responses. There is no denying that most post-covid learning experiences were quite different. Yet, since NSSE generally asks about experiences "during the current school year" respondents' comprehension, retrieval, and judgment about survey questions were on a broader time frame. This likely explains why our analysis of the coronavirus disruption on response rates and engagement results showed minimal impact, in particular the effect on Engagement Indicator scores appears negligible. While this analysis provides some assurance of data quality and continuity of results, it would be a missed opportunity not to mine NSSE 2020 results for insights about what the disruption revealed in undergraduate education.

Here are just a few ideas to stimulate your thinking:

Compare Pre- and Post-Disruption Responses to Understand What Your Data Represent. Assuming you have enough respondents in both categories, this analysis allows your campus to understand who and what your NSSE 2020 data represent. Explore if your descriptive response patterns align with our preliminary analysis findings, and if there are pre-post differences in your Engagement Indicator scores. How do your EIs compare to previous NSSE administrations? If different, is it appropriate to attribute this to the coronavirus disruption or does it reflect other institutional changes? Doing this comparison and documenting findings and interpretations will be important to assure that spring data are used appropriately for assessment and improvement.

Focus on Post-Disruption Responses for Insights into Remote Education. Who are your post-disruption respondents and what can you learn about their engagement and the shift to a remote experience? What is the relationship between their engagement results and the intent to return variable, or their final grades and other outcome assessments? What sentiments did these students express in their comments at the end of the survey? Drops in engagement scores may suggest aspects of the educational experience most challenged in the radical shift to remote learning, and looking within this population might expose the challenges experienced by students in certain majors or among student populations. While our analysis shows minimal impact, you may find differences among your students that reveal the impact of the change itself (having to move home, adjusting to remote learning, getting access to resources, changed expectations, etc.). What might this suggest for your campuses future plans for a hybrid or remote undergraduate experience?

Highlight Institutional Strengths to Inform Planning for Academic Year 2020-21. Your strongest performing items and highest Engagement Indicators in NSSE 2020 results could be viewed as a reminder about what your institution does well. Let these data highlight and point to aspects of your undergraduate experience that should be attended to as your campus plans for a modified Academic Year 2020-21. For example, if particular aspects of student-faculty interaction or collaborative learning strategies among students are a proven strength at your campus, consider what might need to be bolstered or reimagined to assure the notable aspects of your campus culture can continue.

To help with your planning, we will post NSSE 2020 raw data files to the Institution Interface around mid July. With your data in hand, consider using respondents' time stamp or your "covid" variable based on your disruption date (if provided; if not provided the default date was 3/23/20) to compare results before and after the disruption and in relation to findings in NSSE's preliminary analysis.

We're planning a webinar in early August to encourage NSSE 2020 data analysis and hope to feature an exchange of ideas among NSSE users. Please contact me at Jikinzie@indiana.edu if you have an analytical insight or approach to share, or a question to pose for this webinar.

We are eager to help you consider how your NSSE data contributes to your ongoing assessment plans and how it can help you study the impact of disruption to inform future planning.

  • Annual Results
  • Publications & Presentations
  • NSSE Essentials
  • NSSE Sightings (blog)
    • Search Posts

Evidence-Based Improvement in Higher Education resources and social media channels

  • Twitter
  • LinkedIn
  • Facebook
  • Instagram
  • YouTube

RELATED SITES

  • Center for Postsecondary Research
  • Indiana University Bloomington School of Education

Evidence-Based Improvement in Higher Education

Center for Postsecondary Research
Indiana University School of Education
201 N. Rose Avenue
Bloomington, IN 47405-1006
Phone: 812.856.5824
Contact Us


NSSE, FSSE, BCSSE, and the column logo are registered with the U.S. Patent and Trademark Office.
Accessibility | Privacy Notice | Copyright © 2021 The Trustees of Indiana University

Center for Postsecondary Research | Indiana University Bloomington School of Education