
To encourage participating institutions to showcase their NSSE findings, a list of sample analyses accompanied by an explanation of the selected results are featured below. NSSE users can recreate each illustration by downloading, editing, and running the associated SPSS syntax. In some cases we also provide an Excel template.
Data Analysis Examples
Amount of writing by Related-Major Category
To estimate the number of pages of assigned writing, the average number of writing assignments of a given page-length was multiplied by an approximate number of pages for the assignment type (see Estimating Number of Pages Written for calculation details).
| Major Category | First-Year | Senior |
|---|---|---|
| Arts & Humanities | 49 | 81 |
| Biological Sciences, Agriculture, & Natural Resources | 47 | 66 |
| Physical Sciences, Mathematics, & Computer Science | 44 | 56 |
| Social Sciences | 52 | 89 |
| Business | 48 | 73 |
| Communications, Media, & Public Relations | 50 | 81 |
| Education | 46 | 84 |
| Engineering | 46 | 88 |
| Health Professions | 43 | 69 |
| Social Service Professions | 47 | 87 |
*********************************************************.
WRITING BY MAJOR FIELD CATEGORY.
*********************************************************.
***** ESTIMATED PAGES OF ASSIGNED WRITING.
RECODE wrshort (1=0) (2=4.5) (3=12) (4=24) (5=39) (6=54) (7=69) INTO wr1.
RECODE wrmed (1=0) (2=12) (3=32) (4=64) (5=104) (6=144) (7=184) INTO wr2.
RECODE wrlong (1=0) (2=22.5) (3=60) (4=120) (5=195) (6=270) (7=345) INTO wr3.
EXECUTE.
COMPUTE wrpages=wr1+wr2+wr3.
VARIABLE LEVEL
VARIABLE LABELS
EXECUTE.
DELETE VARIABLES wr1 wr2 wr3.
*****CREATE TABLES BY MAJOR FIELD CATEGORY.
CTABLES
/VLABELS VARIABLES=MAJfirstcol IRclass wrpages DISPLAY=DEFAULT
/TABLE MAJfirstcol [C] BY IRclass [C] > wrpages [S][COUNT MEAN]
/CATEGORIES VARIABLES=MAJfirstcol ORDER=A KEY=VALUE EMPTY=INCLUDE
/CATEGORIES VARIABLES=IRclass [1, 4] EMPTY=INCLUDE.
Engagement with Faculty by Sex and Class Level
The following table presents the percentage of students who frequently (very often or often) engaged with faculty in various types of activities arrayed by institution-provided sex and class level information.
| First-Year | Senior | |||
|---|---|---|---|---|
| Females | Males | Females | Males | |
| Talked about career plans with a faculty member | 34% | 32% | 47% | 43% |
| Worked with a faculty member on activities other than coursework (committees, student groups, etc.) | 18% | 21% | 29% | 30% |
| Discussed course topics, ideas, or concepts with a faculty member outside of class | 25% | 29% | 35% | 39% |
| Discussed your academic performance with a faculty member | 29% | 31% | 36% | 34% |
NSSE SAMPLE ANALYSES AND SYNTAX
--FACULTY ENGAGEMENT BY SEX AND CLASS LEVEL.
*********************************************************.
*********************************************************.
****RECODE INTO 'FREQUENTLY' EXPERIENCED .
RECODE SFcareer SFotherwork SFdiscuss SFperform (1, 2 = 0) (3, 4 = 1)
INTO fSFcareer fSFotherwork fSFdiscuss fSFperform.
VALUE LABELS fSFcareer fSFotherwork fSFdiscuss fSFperform 0 'Infrequently' 1 'Frequently'.
VARIABLE LEVEL fSFcareer fSFotherwork fSFdiscuss fSFperform (ordinal).
FREQUENCIES fSFcareer fSFotherwork fSFdiscuss fSFperform.
****CREATE TABLE USING CTABLES COMMAND.
****.
****NOTE: If using NSSE 2013 data replace IRsex with IRgender.
****.
CTABLES
/VLABELS VARIABLES=fSFcareer fSFotherwork fSFdiscuss fSFperform IRclass IRsex DISPLAY=DEFAULT
/TABLE (fSFcareer + fSFotherwork + fSFdiscuss + fSFperform) [COUNT COLPCT F4.0] BY IRclass > IRsex
/CATEGORIES VARIABLES = fSFcareer fSFotherwork fSFdiscuss fSFperform IRsex ORDER=A KEY=VALUE
EMPTY=INCLUDE
/CATEGORIES VARIABLES = IRclass [1, 4] EMPTY=INCLUDE.
****CREATE PERCENTAGES USING FREQUENCIES COMMAND.
****VALID PERCENT MATCHES CTABLE
**FIRST-YEAR FEMALE.
TEMPORARY.
SELECT IF (IRclass eq 1 and IRsex eq 0).
FREQUENCIES fSFcareer fSFotherwork fSFdiscuss fSFperform.
**FIRST-YEAR MALE.
TEMPORARY.
SELECT IF (IRclass eq 1 and IRsex eq 1).
FREQUENCIES fSFcareer fSFotherwork fSFdiscuss fSFperform.
**SENIOR FEMALE.
TEMPORARY.
SELECT IF (IRclass eq 4 and IRsex eq 0).
FREQUENCIES fSFcareer fSFotherwork fSFdiscuss fSFperform.
**SENIOR MALE.
TEMPORARY.
SELECT IF (IRclass eq 4 and IRsex eq 1).
FREQUENCIES fSFcareer fSFotherwork fSFdiscuss fSFperform.
High-Impact Practices
Because of their positive effects on student learning and retention, undergraduate opportunities such as learning communities, service-learning, research with a faculty member, study abroad, internships, and culminating senior experiences are called high-impact practices (Kuh, 2008). High-impact practices share several traits: They demand considerable time and effort, provide learning opportunities outside of the classroom, require meaningful interactions with faculty and students, encourage interaction with diverse others, and provide frequent and meaningful feedback. Participation in these activities can be life-changing.
The table below displays the percentage of first-year students and seniors who participated in selected high-impact practices by several student characteristics. The syntax linked above can be used to recreate this summary table with your own institution's data. From these results, you can compare participation in high-impact practices across a variety of student characteristics.
| First-Year Students | Seniors | ||||||||
|---|---|---|---|---|---|---|---|---|---|
| Learning Community | Service- Learning | Research with Faculty | Learning Community | Service- Learning | Research with Faculty | Internship/ Field Exp. | Study Abroad | Culminating Experience | |
| Sexa | |||||||||
| Female | 16 | 51 | 5 | 27 | 65 | 25 | 54 | 17 | 47 |
| Male | 14 | 52 | 6 | 23 | 57 | 27 | 49 | 12 | 47 |
| Race/ethnicity or internationala | |||||||||
| American Indian or Alaska Native | 18 | 56 | 7 | 27 | 69 | 25 | 49 | 11 | 43 |
| Asian | 14 | 56 | 5 | 23 | 66 | 22 | 47 | 12 | 38 |
| Black or African American | 18 | 55 | 7 | 29 | 68 | 22 | 47 | 9 | 43 |
| Hispanic or Latino | 15 | 55 | 5 | 24 | 64 | 21 | 46 | 11 | 38 |
| Native Hawaiian/ Other Pacific Islander | 11 | 56 | 6 | 28 | 69 | 24 | 46 | 10 | 37 |
| White | 15 | 49 | 5 | 25 | 61 | 27 | 55 | 16 | 49 |
| Other | 16 | 53 | 13 | 15 | 61 | 18 | 33 | 20 | 52 |
| Foreign or nonresident alien | 14 | 66 | 9 | 24 | 72 | 26 | 43 | 24 | 43 |
| Two or more races/ ethnicities | 18 | 53 | 6 | 26 | 62 | 27 | 53 | 16 | 49 |
| Age | |||||||||
| Traditional (First-year < 21, Senior < 25) | 16 | 52 | 5 | 29 | 64 | 31 | 60 | 20 | 53 |
| Nontraditional (First-year 21+, Senior 25+) | 9 | 46 | 7 | 17 | 58 | 16 | 36 | 5 | 35 |
| First-generation statusb | |||||||||
| Not first-generation | 16 | 50 | 6 | 27 | 60 | 30 | 58 | 20 | 51 |
| First-generation | 14 | 54 | 6 | 23 | 63 | 21 | 46 | 9 | 42 |
| Enrollment statusa | |||||||||
| Part-time | 9 | 43 | 5 | 16 | 56 | 14 | 35 | 6 | 33 |
| Full-time | 16 | 52 | 6 | 27 | 63 | 28 | 56 | 17 | 50 |
| Residence | |||||||||
| Living off campus | 12 | 52 | 6 | 24 | 61 | 24 | 50 | 13 | 44 |
| Living on campus | 17 | 51 | 5 | 34 | 63 | 38 | 65 | 27 | 62 |
| Major categoryc | |||||||||
| Arts & humanities | 15 | 47 | 5 | 23 | 54 | 28 | 46 | 25 | 59 |
| Biological sciences, agriculture, natural resources | 17 | 49 | 8 | 26 | 54 | 47 | 55 | 17 | 45 |
| Physical sciences, math, computer science | 14 | 44 | 7 | 20 | 42 | 41 | 47 | 11 | 44 |
| Social sciences | 15 | 49 | 5 | 23 | 60 | 34 | 50 | 21 | 48 |
| Business | 15 | 54 | 5 | 22 | 57 | 13 | 44 | 14 | 43 |
| Communications, media, public relations | 18 | 51 | 5 | 26 | 66 | 22 | 67 | 20 | 57 |
| Education | 16 | 62 | 4 | 37 | 82 | 17 | 69 | 12 | 50 |
| Engineering | 18 | 47 | 6 | 27 | 48 | 34 | 58 | 12 | 60 |
| Health professions | 15 | 57 | 5 | 30 | 80 | 20 | 55 | 9 | 38 |
| Social service professionals | 14 | 57 | 5 | 27 | 71 | 18 | 54 | 9 | 39 |
| Undecided/ undeclared | 12 | 47 | 4 | 19 | 65 | 16 | 30 | 11 | 24 |
| Overall | |||||||||
| 15 | 52 | 6 | 25 | 62 | 26 | 52 | 15 | 47 | |
Note: Participating students are those who responded "Done or in progress" for all HIPs except service-learning, where students reported at least "Some" of their courses included a community-based project.
a. Institution-reported variable
b. Neither parent holds a bachelor's degree
c. NSSE's default related-major categories, based on students' reported major or expected major (first reported major for double majors). Excludes majors categorized as "all other."
For more information on these results and other ideas for using your NSSE results, see the 2014 NSSE Annual Results and Lessons from the Field.
Kuh, G. D. (2008). High-impact educational practices: What they are, who has access to them, and why they matter. Washington, DC: Association of American Colleges and Universities.
*********************************************************.
HIGH-IMPACT PRACTICES BY STUDENT CHARACTERISTICS
This syntax will recreate the Percent Participation in High-Impact Practices by Student
Characteristics table in the High-Impact Practices report.
*********************************************************.
*********************************************************.
***** RECODE AND FLAG PARTICIPATION IN HIGH-IMPACT PRACTICES.
RECODE intern leader learncom abroad research capstone (1, 2, 3 = 0) (4 = 1) INTO
internR leaderR learncomR abroadR researchR capstoneR.
VALUE LABELS internR leaderR learncomR abroadR researchR capstoneR 0 'Not Done' 1 'Done or in progress'.
RECODE servcourse (4, 3, 2=1) (1=0) INTO servcourseR.
VALUE LABELS servcourseR 0 'None' 1 'At least some'.
EXECUTE.
*********************************************************.
***** RECODE AGE INTO TRADITIONAL AGE AND NOT TRADITIONAL AGE.
NUMERIC dAge (F4.0).
VARIABLE LABELS dAge 'Flag for traditionally aged students (>15; <21 for FY, <25 for SR)'.
VALUE LABELS dAge 0 'Not traditional age' 1 'Traditional age (>15; <21 for FY, <25 for SR)'.
RECODE age (SYSMIS=SYSMIS) (ELSE=0) INTO dAge.
EXECUTE.
IF (IRclass=1 AND age GE 16 AND age LT 21) dAge=1.
IF (IRclass=4 AND age GE 16 AND age LT 25) dAge=1.
EXECUTE.
*********************************************************.
***** RECODE LIVING INTO ON CAMPUS AND OFF CAMPUS.
NUMERIC oncampus (F4.0).
RECODE living (1 THRU 2 =1) (3 THRU 5=0) INTO oncampus.
VARIABLE LABELS
'Student living on campus (collapsed recode of living)'.
VALUE LABELS
0 'No' 1 'Yes'.
EXECUTE.
**** FOR CANADIAN INSTITUTIONS RECODE LIVING_CA TO ONCAMPUS.
IF (living_ca LE 2) oncampus=1.
IF (living_ca GE 3) oncampus=0.
EXECUTE.
*********************************************************.
***** CREATE FIRST-GENERATION STATUS.
NUMERIC
(F4.0).
RECODE parented (1 thru 4=1) (5 thru 7=0) INTO firstgen.
VARIABLE LABELS
"First-Generation Status (neither parent/guardian holds a bachelor's degree)".
FORMATS firstgen(F4.0).
VALUE LABELS
0 'No' 1 'Yes'.
EXECUTE.
**** FOR CANADIAN INSTITUTIONS RECODE PARENTED_CA TO
.
IF (parented_ca LE 4) firstgen = 1.
IF (parented_ca GT 4) firstgen = 0.
EXECUTE.
*********************************************************.
***** SYNTAXT TO CREATE TABLE.
****NOTE: If using NSSE 2013 data replace 'IRsex' with 'IRgender'.
CTABLES /TABLE (IRsex + IRrace + dage + FirstGen + IRenrollment + oncampus + MAJfirstCol) [COUNT ROWPCT F4.0]
BY IRclass > (learncomR + servcourseR + researchR + internR + abroadR + capstoneR)
/CATEGORIES VARIABLES = IRsex IRrace dage FirstGen IRenrollment oncampus MAJfirstCol TOTAL=NO EMPTY=INCLUDE
/CATEGORIES VARIABLES = IRrace [1, 2, 3, 4, 5, 6, 7, 8, 9] EMPTY=INCLUDE
/CATEGORIES VARIABLES = dAge [1, 0] EMPTY=INCLUDE
/CATEGORIES VARIABLES = MAJfirstcol [1, 2, 3, 4, 5, 6, 7, 8, 9, 10, 999] EMPTY=INCLUDE
/CATEGORIES VARIABLES = learncomR servcourseR researchR internR abroadR capstoneR [0, 1, SUBTOTAL].
The Relationship of Residence Life with Selected Engagement Measures
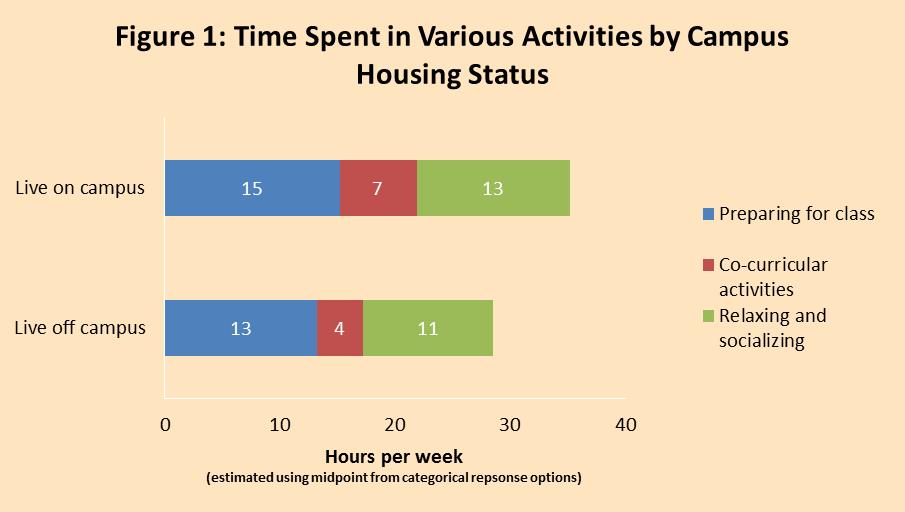
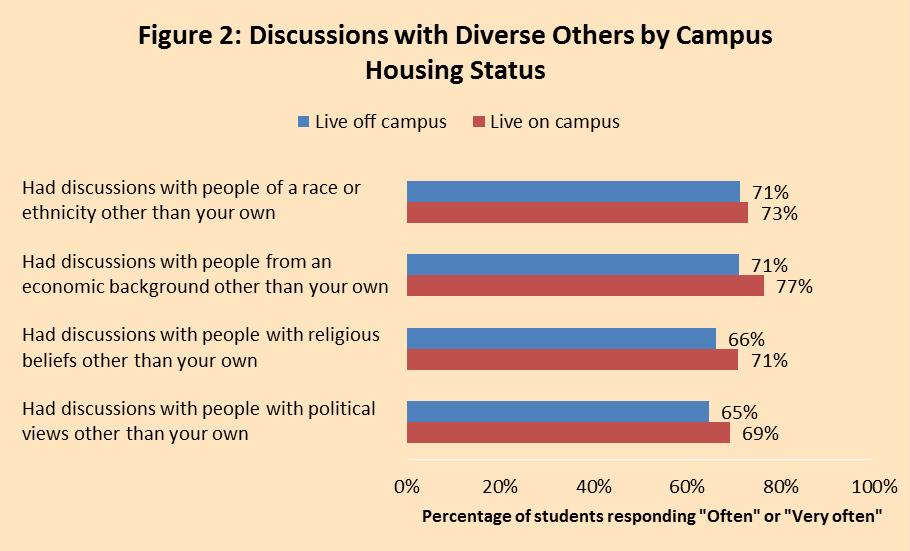
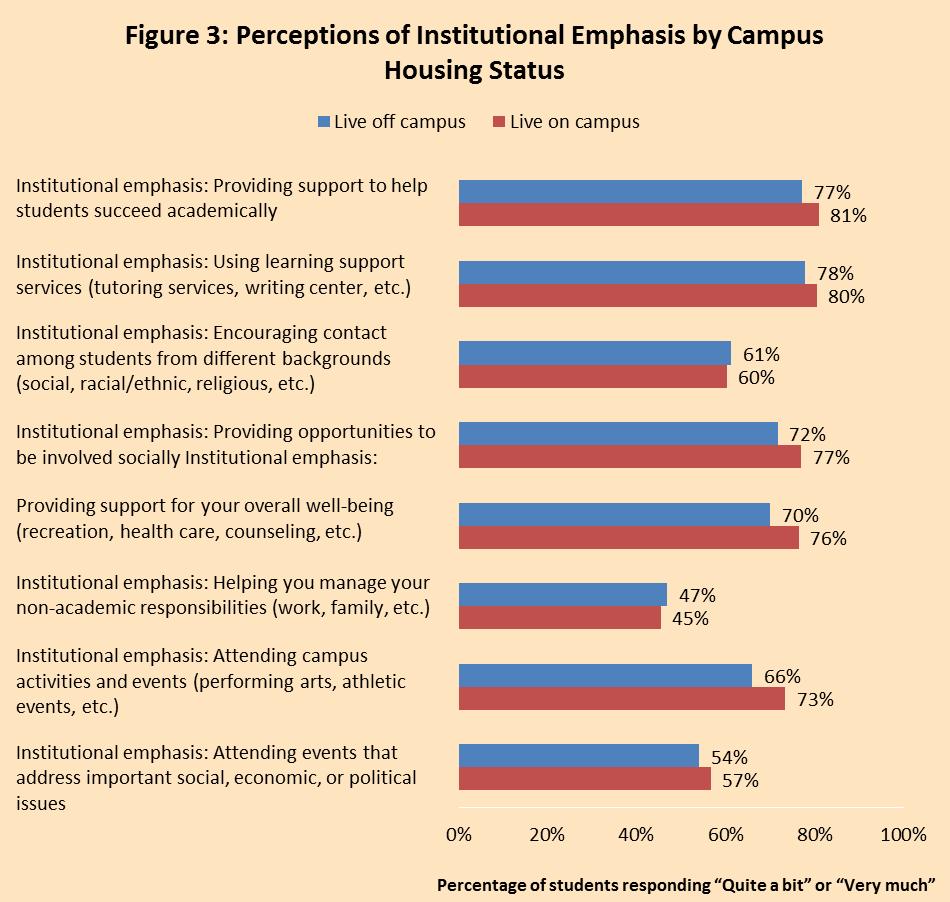
Successful residence life programs create an environment that promotes "seamless learning environments" (Kuh, 1996) with both curricular and co-curricular learning and engagement. Residence life staff may use NSSE data to assess how well their programs and facilities foster important forms of engagement, including course learning, social integration, experiences with diversity, and a supportive campus environment. The three figures below compare full-time, first-year students of traditional age (under 21) who live on campus with those living
Results from NSSE 2014 indicate that first-year students living on campus spent, on average, around two more hours per week than their
While first-year students living on and
Finally,
For more information on these results and other ideas for connecting NSSE results to specific campus programs and units, see the Lessons from the Field and NSSE's Annual Results.
Kuh, G. D. (1996). Guiding Principles for Creating Seamless Learning Environments for Undergraduates. Journal of College Student Development, 37(2), 135-48.
*********************************************************.
****SPSS Syntax: Residence Life.
*********************************************************.
***The following syntax will work with NSSE data
beginingwith the 2013 administration***.
***The example analysis used NSSE data from the 2014 administration***.
***Insert the directory path to your NSSE data file or open your NSSE data file manually***.
GET FILE = 'C:\nsse\nsse14.sav'.
***Selecting respondents that met NSSE eligibility and sampling criteria***.
***If your institution has a targeted oversample (sample = 4) or locally administered sample or oversample (sample = 5)
that you want to include in the analysis, change the value of 'sample' to match that criteria***.
SELECT IF (eligible = 1 AND sample LE 3).
***Recoding living into living on campus and living off campus***.
NUMERIC oncampus (F4.0).
RECODE living (1 THRU 2 =1) (3 THRU 5=0) INTO oncampus.
VARIABLE LABELS
oncampus'Student living on campus (collapsed recode of living)'.
VALUE LABELS
oncampus0 'No' 1 'Yes'.
EXECUTE.
***Recodes "Very often" and "Often" into "Frequently" and "Sometimes" and "Never" into "Infrequently"***.
RECODE DDrace DDeconomic DDreligion DDpolitical (1=1) (2=1) (3=2) (4=2) INTO xDDrace xDDeconomic xDDreligion xDDpolitical.
VALUE LABELS xDDrace xDDeconomic xDDreligion xDDpolitical
1 'Infrequently'
2 'Frequently' .
EXECUTE.
***Recodes "Very much" and "Quite a bit" into "Substantial" and "Some" and "Very little" into "Not substantial".
RECODE SEacademic SElearnsup SEdiverse SEsocial SEwellness SEnonacad SEactivities SEevents (1=1) (2=1) (3=2) (4=2) INTO
xSEacademic xSElearnsup xSEdiverse xSEsocial xSEwellness xSEnonacad xSEactivities xSEevents .
VALUE LABELS xSEacademic xSElearnsup xSEdiverse xSEsocial xSEwellness xSEnonacad xSEactivities xSEevents
1 'Not substantial'
2 'Substantial' .
EXECUTE.
***Selecting full-time,
traditional agefirst-year students and running the time on task analysis***.
TEMPORARY.
SELECT IF (IRclass = 1 AND IRenrollment = 1 AND age LT 21).
MEANS TABLES=tmprephrs
tmcocurrhrs tmrelaxhrsBY
oncampus/CELLS MEAN.
***Selecting full-time,
traditional agefirst-year students and running the engagement analysis***.
TEMPORARY.
SELECT IF (IRclass = 1 AND IRenrollment = 1 AND age LT 21).
CROSSTABS oncampus BY xDDrace xDDeconomic xDDreligion xDDpolitical
/CELLS COUNT ROW.
TEMPORARY.
SELECT IF (IRclass = 1 AND IRenrollment = 1 AND age LT 21).
CROSSTABS oncampus BY xSEacademic xSElearnsup xSEdiverse xSEsocial xSEwellness xSEnonacad xSEactivities xSEevents
/CELLS COUNT ROW.
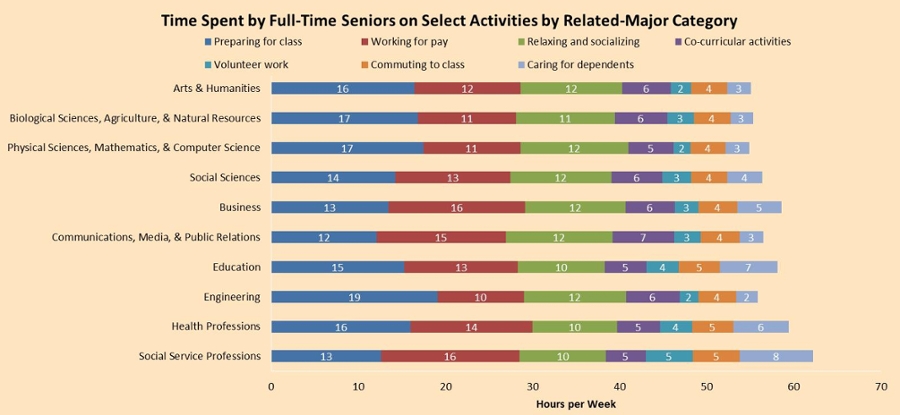
Time Spent on Selected Activities by Related-Major Category
Understanding how students allocate their time among academic work, employment, and other activities and commitments offers insight into both student support needs and programmatic differences in expectations and requirements.
The figure below shows the average amount of time full-time seniors in NSSE 2014 spent on seven activities across ten categories of related majors (hours per week are estimated using the midpoint from the categorical response options). While seniors in different related-major categories spent their time in similar ways across a few activities (relaxing or socializing, co-curricular activities, and community service or volunteer work), they varied greatly in time spent preparing for class, ranging from 12 hours per week for communications, media, and public relations majors to 19 hours per week for engineering majors. Institutional users can reproduce this analysis using the SPSS syntax to produce the average amount of time seniors spent on various activities and input these numbers into the Excel graphing template to produce the graph below.
For more information on these results and other ideas for connecting NSSE results to specific campus programs and units, see Lessons from the Field and the 2011 NSSE Annual Results. See NSSE's ten related-major categories for a list of individual majors within each category.
*********************************************************.
****SPSS Syntax: Time Spent on Selected Activities.
*********************************************************.
***The following syntax will work with NSSE data begining with the 2013 administration***.
***The example analysis used NSSE data from the 2014 administration***.
***Insert the directory path to your NSSE data file or open your data file manually***.
GET FILE = 'C:\nsse\nsse14.sav'.
***Selecting respondents that met NSSE eligibility and sampling criteria***.
***If your institution has a targeted oversample (sample = 4) or locally administered sample or oversample (sample = 5)
that you want to include in the analysis, change the value of 'sample' to match that criteria***.
SELECT IF (eligible = 1 AND sample LE 3).
VARIABLE LEVEL tmprephrs tmworkhrs tmrelaxhrs tmcocurrhrs tmservicehrs tmcommutehrs tmcarehrs (SCALE).
***Selecting full-time seniors and running the time on task analysis***.
TEMPORARY.
SELECT IF (IRclass = 4 AND IRenrollment = 1).
MEANS TABLES = tmprephrs tmworkhrs tmrelaxhrs tmcocurrhrs tmservicehrs tmcommutehrs tmcarehrs BY MAJfirstcol
/CELLS MEAN.
***This analysis can also be run with the CTABLES command as follows***.
TEMPORARY.
SELECT IF (IRclass = 4 AND IRenrollment = 1).
CTABLES /TABLE MAJfirstcol BY ((tmprephrs + tmworkhrs + tmrelaxhrs + tmcocurrhrs + tmservicehrs + tmcommutehrs + tmcarehrs) [MEAN]).
***The syntax above runs on NSSE's standard major categories***..
***To run the analysis using your own grouping of majors, create a new variable and assign it specific majors***.
***For example, the syntax below creates a new variable, majorcat, and assigns English, French, and Spanish to category 1,
***Art and Art History to cateogry 2, Biology and Chemistry to category 3, and Mathematics and Physics to category 4.
NUMERIC majorcat (F4.0).
IF any(MAJfirstcode, 4, 5, 6) majorcat = 1.
IF any(MAJfirstcode, 1, 3) majorcat = 2.
IF any(MAJfirstcode, 16, 35) majorcat = 3.
IF any(MAJfirstcode, 38, 39) majorcat = 4.
VALUE LABELS majorcat 1 'Languages' 2 'Art' 3 'Biology & Chemistry' 4 'Math & Physics'.
***Run the time on task analysis with new categories of majors***.
TEMPORARY.
SELECT IF (IRclass = 4 AND IRenrollment = 1).
MEANS TABLES = tmprephrs tmworkhrs tmrelaxhrs tmcocurrhrs tmservicehrs tmcommutehrs tmcarehrs BY majorcat
/CELLS MEAN.
***The analysis can also be run using the CTABLES command***.
TEMPORARY.
SELECT IF (IRclass = 4 AND IRenrollment = 1).
CTABLES /TABLE majorcat BY ((tmprephrs + tmworkhrs + tmrelaxhrs + tmcocurrhrs + tmservicehrs + tmcommutehrs + tmcarehrs) [MEAN]).