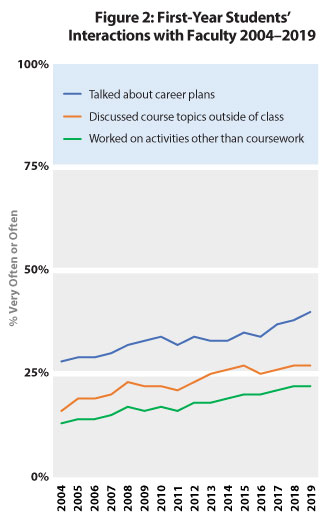
Interactions with Faculty in the First Year of College
Three forms of first-year students’ interactions with faculty show notable positive trends: talking about career plans, discussing course topics outside of class, and working with faculty on activities other than coursework (Figure 2). Indeed, the portion of first-year students who interacted frequently (“very often” or “often”) in each of these areas increased by more than 10 percentage points over the time span. This suggests that by and large, faculty who teach first-year students have devoted more effort to having meaningful conversations with students outside of the classroom—a form of engagement that helps to socialize new students, promotes their persistence, and facilitates their ongoing development. It also suggests that institutions have intentionally structured orientations, career services, and support units to connect students to the resources they most need.
Time Spent in Academic Preparation
Students also appear to spend more time on academic preparation than they did over a decade ago, although this trend appears to have plateaued in recent years (Figure 3). For example, the percentage of first-year students who spent more than 15 hours per week preparing for class (studying, reading, writing, doing homework or lab work, etc.) increased from 34% in 2004 to as high as 45% in 2017. Seniors matched this pattern, increasing about 10 percentage points and leveling off in recent years. These increases correspond to as much as two more hours per week for all students on average. Spending more time on academics is a positive outcome, whether the result is from higher expectations, more emphasis on collaborative learning, or wider adoption of new instructional methods such as flipped classrooms, problem-based learning, or realworld applications.
This is an especially encouraging finding, because previous NSSE analyses (NSSE, 2016) found that the average amount of time that firstyear students devote to academic preparation is strongly correlated with institutional retention and graduation rates.
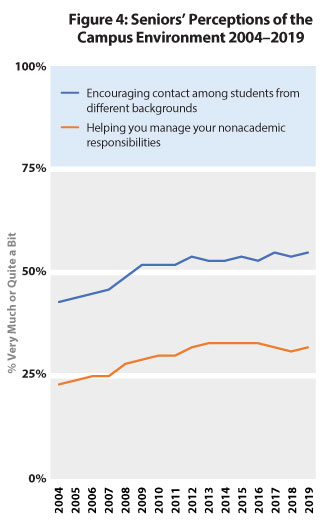
Perceptions of the Campus Environment
Finally, two positive trends exist related to perceptions of the campus environment. First, students increasingly rated the emphasis on diverse interactions as substantial (“very much” or “quite a bit”), with the percentage rising more than 10 points for both first-year students and seniors, and most of the increases in the first half of the time span. For example, seniors’ perceptions of substantial institutional emphasis on diverse interactions increased from 43% to 55% (Figure 4). Support for helping students manage their nonacademic responsibilities such as work or family increased for first-year students and seniors. For example, seniors’ perceptions increased from 23% to a high of 33% before leveling off in recent years. Such results are encouraging considering the changing demographics of higher education, with historically underrepresented and nontraditionalage students enrolling in larger numbers.
Institutions see improvement in areas that they measure and attend to as a priority. Of course, not everything NSSE measures has increased as much, if at all, but we find it promising to observe growth over 16 years in meaningful interactions with faculty, time devoted to academic work, and supportive aspects of the campus environment. Colleges and universities that participate in NSSE deserve credit for taking their engagement results seriously and doing the hard work of changing practice to positively affect the quality of their students’ experiences.