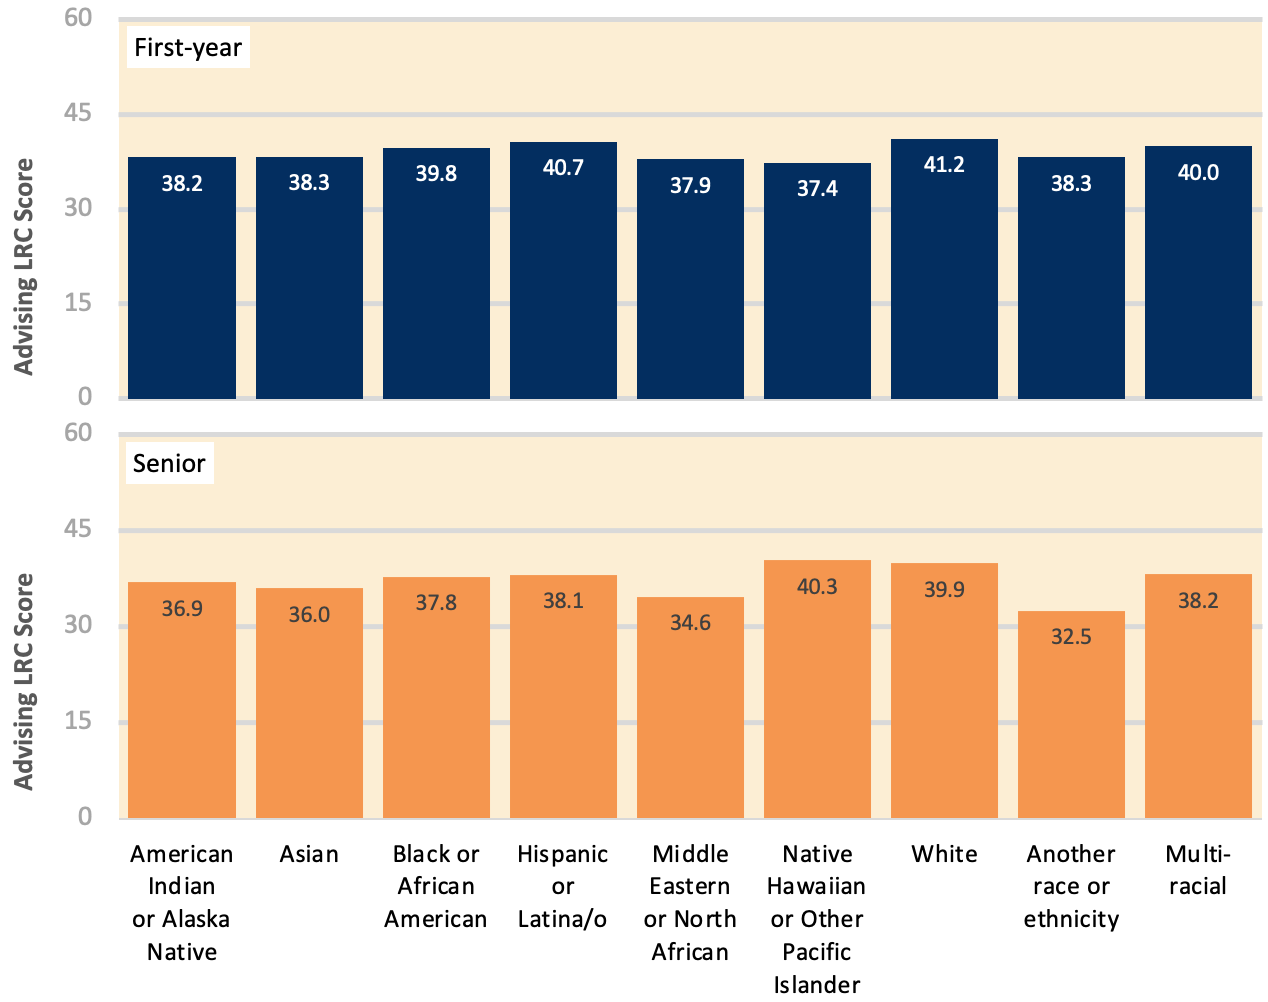
We used the 60-point Advising LRC Scale to explore how the interpersonal attentiveness of advisors relates to the educational experience for various groups of students. For example, differences among students by racial/ethnic identity are generally small (Figure 1). LRC scores for first-year students ranged from about 37 (Native Hawaiian or Other Pacific Islander) to 41 (White), and for seniors from about 33 (Another race or ethnicity) to 40 (Native Hawaiian or other Pacific Islander) for seniors. Such differences are worth exploring if even small effects are related to real benefits or consequences for some groups of students. Advising leaders are encouraged to consider how their day to day policies and practices affect diverse students differently.
Advising LRC by Racial/Ethnic Identity
Investigate Further in Tableau
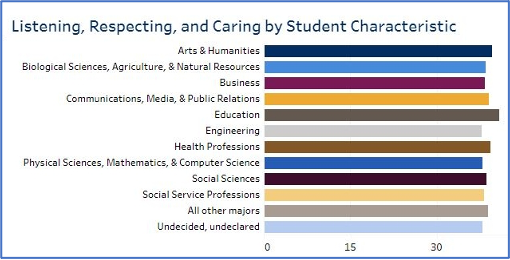
Filter by Selected Student Characteristics
Our Tableau dashboard allows you to explore results by any combination of student and institution characteristics.
Visit the Tableau dashboard