Survey incentives and the posting of links to learning management systems (LMS) appear to substantially improve response rates regardless of institutional control and enrollment size.
Incentives and, more recently, posting survey links to LMSs are increasingly used to boost response rates among NSSE participating institutions. Past studies aimed at understanding the impact of incentives among a college student population, however, have often relied on data from a single institution. Furthermore, studies analyzing how LMS can be used to promote survey completion--a relatively new, understudied recruitment approach--are rare if not entirely absent. Though ideal for causal claims, conducting large-scale randomized controlled studies focused on these two survey recruitment practices is generally not practical given the costs involved. Pairing a quasi-experimental analytical method with a large analytical sample, this study finds that both recruitment techniques do appear to improve NSSE response rates in meaningful ways regardless of institution public-control status and enrollment size.
A little history about boosting NSSE response rates
Several studies using NSSE data suggest that offering incentives and posting links to an LMS do in fact boost response rates. Using data from over 530 institutions that participated in the 2013 NSSE administration, Sarraf and Cole (2014) estimated that using lottery incentives is associated with a 3 to 6 percentage point increase in response depending on the type of gift awarded (e.g., technology item, gift card). They also found that institutions that promote NSSE to students above and beyond using an incentive (e.g., advertising the importance of NSSE in a campus newspaper) had a 4 to 5 percentage point increase in response. In a randomized controlled study with nine institutions, posting survey links to LMS showed on average a 5-percentage point increase in response though the effects varied widely across colleges, ranging from no change to as much as 20 percentage points (Sarraf, 2016). In a more recent study using latent growth curve modeling with NSSE panel data from 1,062 institutions that participated at least three times between 2010 and 2018, incentives were found to increase response rates anywhere from 3 to 5 percentage points depending on the year (Sarraf, 2019). No statistically significant change was found for those who posted survey links to their LMS in three out of the four years--the 2017 administration being the exception showed a four-percentage point increase.
These historical results generally validate one another: incentives generally boost response rates among NSSE participants, but the effect of using LMS varies greatly across institutions. That said, investigating how incentives and LMS effects interact with institutional characteristics is in need of exploration. From earlier NSSE research (Sarraf & Cole, 2014) two characteristics in particular--enrollment size and public/private control status--showed particularly strong independent relationships to institutional response rates. Public institutions and those with larger undergraduate enrollments on average showed lower response rates relative to private institutions and those with smaller enrollments. This state of affairs is somewhat expected. Based on anecdotal accounts from NSSE, the larger the institution the more challenging it is to get the attention of students that receive a multitude of survey invitations from across campus.
Key questions
Using over five-hundred colleges and universities that participated in NSSE multiple times between 2015 and 2020, this study relies on administrative panel data to estimate the impact of incentives and the use of LMS links on response rates. Quasi-experimental statistical methods for panel data are employed, allowing for relatively strong causal claims by controlling for all stable institutional characteristics. The current study aimed to answer the following research questions:
- On average, what is the change in response rate for institutions that use survey incentives?
- On average, what is the change in response rate for institutions that use their learning management systems for promoting NSSE and posting personalized survey links?
- Is the effect of either survey recruitment approach influenced by the size of the institution or whether it's under public or private control?
Who participated and how were the data analyzed?
The study's analytical sample included 512 US institutions that participated in at least three NSSE survey administrations between 2015 and 2020. Participating institutions varied in terms of their response rate, use of incentives and LMS, enrollment size, and control status (see Table 1). Across the six administrations, response rates ranged from 4% to 89% with annual averages ranging from 27% to 30% (and an average standard deviation of approximately 12.0%). The proportion of institutions that used incentives on an annual basis ranged from 55% to 62% with no discernable trend over time. In contrast, institutions have increasingly employed their LMSs, rising from 4% in 2015 to 22% in 2020. Forty-three percent are publicly controlled and enroll about 6,160 undergraduate students each year on average.
Fixed effects regression answers this study's three research questions. According to Allison (2009), this quasi-experimental approach offers an alternative to a randomized controlled experiment, the gold standard for making causal claims, whereby comparisons are made between groups that have comparable background characteristics but differ in their exposure status to some treatment or intervention--such as use of incentives or an LMS in this study. The basic tenet underlying fixed effects regression is that subjects serve as their own statistical control while estimating the average treatment effect of any time-varying predictor variable. The difference between the outcome before and after the treatment is averaged across all units in a population to estimate its impact. For this reason, it is critical to have a sufficient number of subjects that change their treatment status across time at least once. Twenty-five percent (n=130) and 41% (n=209) of institutions changed their incentive or LMS usage status at least once, respectively. Though the model controls for all stable characteristics it does not control for any time-varying predictors.
Stata/IC (version 14.2) estimated all fixed effects regression models, which uses OLS regression with demeaned variables and achieved with the help of xtreg command (an approach equivalent to including a set of dummy variables for all colleges). All models applied robust clustered standard errors, too, in order to address the dependency of error terms within schools across time. To address the first and second research question, response rate was regressed on both the incentive usage and LMS usage dummy variables in addition to a set of dummy variables for administration year to reduce the chance for any spurious correlations. The two dummy variable coefficients estimate the average treatment effect or change in response rate percentage points when individual institutions did and did not use these survey recruitment techniques. Interpretation of each coefficients' direction, size and statistical significance is provided.
For the final research question, the focus turned to how each recruitment technique's effect on response rate varied by institution enrollment size (measured in thousands and grand-mean centered for easier interpretation) and public-institution control status. Though both of these longitudinally stable predictors could not be estimated independently as part of a fixed effects model, including them as part of an interaction term with time-varying predictors was possible. To facilitate this investigation, the significance of four interaction terms was tested one-by-one: incentive use by public status, LMS use by public status, incentive use by enrollment size, and LMS use by enrollment size. Stata's margins command allowed for estimating and graphing average marginal effects (AME) to assist with understanding these interaction terms. AME first estimates the difference in response rate for each school at each time point before and after changing the status of either incentive use or LMS use (keeping the other variable at its original value), and then calculates the average of all these individual effects.
Evidence collected
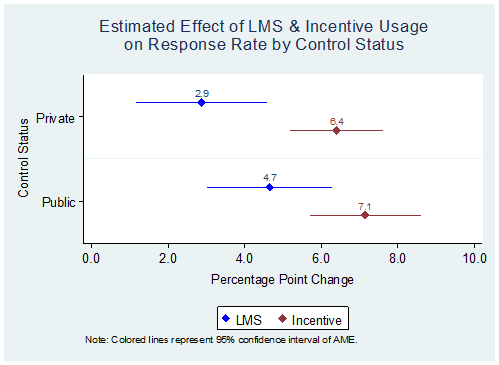
Results indicate that both incentive and LMS usage have a meaningful, positive and statistically significant relationship to institution-level response rates. Institutions that use incentives can expect to raise their response rate by 6.6 percentage points (t = 11.16, p < .001, 95% CI [5.39, 7.70], on average, controlling for LMS usage status and all stable institutional characteristics (see Figure 1 at end of page). Given an approximate 30% average annual response rate, this effect represents a substantial increase of over 20%. Regarding this study's second research question, institutions that use their LMS to post survey links can expect to raise their response rate by 3.9 percentage points (t = 6.39, p < .001, 95% CI [2.69, 5.08], on average, controlling for incentive usage status and all stable institutional characteristics. Though a weaker effect than seen with incentive usage, using LMS boosts response about 10%, also a meaningful change that would be viewed favorably by many NSSE participants. A statistical test confirmed that the incentive effect is greater than the one for LMS usage.
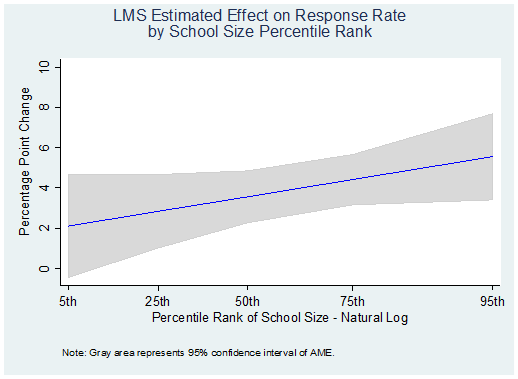
No strong evidence exists that the effects of incentive and LMS usage are much different for public versus private institutions. Only the interaction between LMS usage and public status approaches statistical significance (t = 1.6, p = 0.11). To illustrate the extent of a potential interaction between these two variables, Figure 1 presents the AME for this recruitment technique by public-institution status (as well as for incentive usage). Though a test of LMS's effect comparing public and private institutions is not statistically significant at the 0.10 level, the graph suggests this may be an interaction deserving of further research. Figure 2 also illustrates the AME for LMS usage but across institution enrollment size (natural log transformed to address its non-normal distribution). As evident from this graph, a statistically significant interaction effect exists (p < 0.10)--the effect of LMS on response rate increases as institution size increases. Across the span of institution enrollment sizes testing indicates LMS, as well as incentive usage, to have a positive and statistically significant effect. The very smallest institutions do not appear to benefit directly.
Final considerations
One caveat should be considered along with these results. Ideally, it would have been beneficial, if available, to include one more time-varying predictor in the fixed effects regression model to minimize the chance of inaccurate effect estimates: promotional efforts institutions put forth above and beyond the use of incentives and LMS. The study by Sarraf & Cole (2014) previously reviewed indicates that approximately 68% of the institutions that use incentives also promote their NSSE administration, a constellation of behaviors that are associated with higher response rates as well.
To the best of our knowledge, this is the first large-scale, quasi-experimental study within the U.S. higher education context to investigate the effect of using survey incentives or LMS to boost response rates. In the case of incentive usage, earlier studies either used a randomized controlled, single institution experimental approach or a large-scale, multi-institution data source with a statistical model unable to make strong causal inferences. For LMS usage, NSSE research has been the sole source of information about its utility among colleges, based on one small-scale randomized experiment and another study that used a method allowing for only weak causal claims. That said, the results of this study are relatively consistent with earlier studies using NSSE data in terms of the impact that survey incentives and LMS have on boosting survey response. Ultimately, incentives and LMS appear to make a difference--with incentives making more of a difference on average.
This study may also be one of the first to use a robust data source with quasi-experimental methods to explore the extent to which different survey recruitment techniques impact response rates at various types of institutions. It appears that, with few exceptions, institutions regardless of their size and public-control status can benefit from using these techniques. In an age where colleges are struggling to get the attention of their students, this should be welcome news.
References
Allison, P. D. (2009). Fixed effects regression models. SAGE publications.
Sarraf, S. (May 2019). How are survey response rates changing? Findings from NSSE. Poster presentation at the Association for Institutional Research Annual Forum. Denver, CO. Retrieved from https://scholarworks.iu.edu/dspace/handle/2022/24059
Sarraf, S. (2016). Survey recruitment using student portals and learning management systems [Webinar]. Retrieved from https://scholarworks.iu.edu/dspace/handle/2022/23702
Sarraf, S., & Cole, J. S. (2014). Survey lottery incentives and institutional response rates: An exploratory analysis. Paper presented at the Association for Institutional Research Annual Forum. Orlando, FL. Retrieved from https://scholarworks.iu.edu/dspace/handle/2022/24244