• Skip to Content
  • Skip to Main Navigation
  • Skip to Search

NSSE logo

NSSENSSENSSE

Open Search
  • NSSE
    • About NSSE
      • Conceptual Framework
      • Positions and Policies
      • Advisors
      • Partners
      • Employment
    • Survey Instruments
      • Topical Modules
      • Engagement Indicators
      • High-Impact Practices
    • Registration Details
      • Pricing
      • Campus Contacts
      • Administration Checklist
    • Administering NSSE
      • Population File
      • Customizing NSSE
      • Recruitment Method
        • Folder Name
      • Encouraging Participation
      • Terms of Participation
      • Accessibility
      • Data Security
    • Reports & Data
      • NSSE Administration Overview
      • Data Files
      • Sample Report
      • Institutional Report Guide
      • Report Builder
      • Data Summaries & Interactive Displays
    • Working with NSSE Data
      • Data Codebooks
      • Syntax
    • Psychometric Portfolio
      • Response Rates
    • NSSE Shorts (New)
      • Pricing and Registration
      • Administration Instructions
      • Item Sets
      • Reports & Data
      • Dashboard LogIn
  • FSSE
    • FSSE Portal Log-in
    • NEW Customizable Pathways
    • About FSSE
    • Survey Instruments
      • Content Modules
      • FSSE Scales
      • Disciplinary Areas
      • Consortium Questions
      • FSSE Classic (Pre 2026)
        • Main Survey
        • Topical Modules
    • Registration & Pricing
    • Administering FSSE
      • Administration Overview
      • Confidentiality
      • Customization
        • Preparing for Message Delivery
        • Population File Instructions
      • Data Security
      • IRB Protocol
        • Informed Consent
      • Locating Your Data & Results
      • Sample Reports
        • Administration Summary
        • FSSE Respondent Profile
        • FSSE Topical Module Report
        • FSSE Disciplinary Area Report
        • FSSE-NSSE Combined Report
        • FSSE Frequency Report
        • FSSE Snapshot Report
      • Terms of Participation
    • Findings, Data, & Reports
      • FSSE Overview
      • Content Summaries
      • Data Visualizations
      • Data Use Examples
    • Working with FSSE data
      • Using FSSE Data
      • Analysis Resources
      • Data User's Guide
    • Psychometric Portfolio
  • BCSSE
    • About BCSSE
    • BCSSE Survey
      • BCSSE Scales
    • Fall Check-In
    • Registration & Pricing
    • Administering BCSSE
      • Administration Protocol and Procedures
      • BCSSE Contacts
      • Demonstration Dashboard Portal
      • Institution Participation Agreement
      • IRB
      • Data Security and Accessibility
    • Reports & Data
      • BCSSE Overview
      • Accessing BCSSE Data
      • Summary Tables
    • Working with BCSSE data
      • Additional Resources
    • Dashboard Log-in
  • Support & Resources
    • For Participating Institutions
      • How Institutions Use Their Data
        • Lessons from the Field
          • Institution Examples
        • NSSE Data Use in Brief
        • Search for examples
        • Displaying Results
        • Data Use Teams
      • Data & Results Guides
        • Student Success Mapping
        • Navigating Your Institutional Report
        • Tips for More Inclusive Data Sharing and Analysis
        • Data User's Guide: Sense of Belonging
        • Accreditation Toolkits
        • Sharing and Disseminating NSSE Results
        • NSSE Data User’s Guide
        • Campuswide Mapping
        • Contextualizing NSSE Effect Sizes
        • Custom Analysis
      • Workshops and Webinars
    • For Partnerships
      • Special Projects
    • For Students & Parents
      • Pocket Guide
        • English
        • Spanish
    • For All Audiences
  • Research
    • Annual Results
      • Annual Results 2023
        • Special Report 1
        • Special Report 2
      • Annual Results 2022
        • 1. Rebounding Engagement
        • 2. Digging Deeper Into HIP Quality
        • 3. Hot Topics in Higher Ed
      • Past Annual Results
    • Publications & Presentations
      • Foundational Publications
      • Featured Publications
      • Recent Presentations
      • Lessons from the Field
      • DEEP Practice Briefs
      • Search
    • NSSE Essentials
    • NSSE Sightings (blog)
      • Search Posts
  • Institution Login
  • BLOG
  • Contact Us

Our Research: Projects,
Publications, and More

  • Home
  • NSSE
    • About NSSE
    • Survey Instruments
    • Registration Details
    • Administering NSSE
    • Reports & Data
    • Working with NSSE Data
    • Psychometric Portfolio
    • NSSE Shorts (New)
  • FSSE
    • FSSE Portal Log-in
    • NEW Customizable Pathways
    • About FSSE
    • Survey Instruments
    • Registration & Pricing
    • Administering FSSE
    • Findings, Data, & Reports
    • Working with FSSE data
    • Psychometric Portfolio
  • BCSSE
    • About BCSSE
    • BCSSE Survey
    • Fall Check-In
    • Registration & Pricing
    • Administering BCSSE
    • Reports & Data
    • Working with BCSSE data
    • Dashboard Log-in
  • Support & Resources
    • For Participating Institutions
    • For Partnerships
    • For Students & Parents
    • For All Audiences
  • Research
    • Annual Results
    • Publications & Presentations
    • NSSE Essentials
    • NSSE Sightings (blog)
  • Search
  • Institution Login
  • BLOG
  • Contact Us
  • Home
  • Research
  • NSSE Sightings (blog)

NSSE Pulse Reveals How Students and Institutions Navigated the Pandemic

Jillian Kinzie, Shimon Sarraf and Alexander McCormick

Wednesday, June 23, 2021

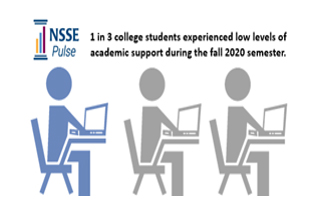
Graphical image of three figures representing students at desks looking at laptops with the NSSE Pulse logo above them. Caption reads "1 in 3 college students experienced low levels of academic support during the fall 2020 semester."

In fall 2020 NSSE offered a special short survey - NSSE Pulse - at the start of a very uncertain academic year. The short online survey provided an opportunity to check-in with students to gauge how they were adjusting and managing during the pandemic. It included selected questions from NSSE on academic challenge and success, interactions with peers, faculty, and staff and sense of belonging that are critical to persistence. Students were also asked about conditions for online learning, concern for health and adherence to health policies, and were invited to share their most satisfying and most disappointing experiences via an open-ended prompt. The survey was administered using Qualtrics and participating institutions received results via an interactive dashboard.

Results helped 190 participating institutions in the US and Canada diagnose shortcomings and strengths and inform campus action. Participating institutions were able to use their Pulse dashboard results to filter data by course modality, residence, and student characteristics including year in college, first-generation status, racial/ethnic identity, and other relevant filters to gain a more nuanced understanding of students experiences and whether some students needed particular attention.

NSSE Pulse provided participating campuses useful data about what students were experiencing. For example, Northern Michigan University summarized their Pulse data in a short report based on the way students were experiencing their courses in the fall semester and also created their own dashboard display, encouraging departments to filter data to respond to student concerns.

Massachusetts College of Liberal Arts disseminated Pulse data about sense of belonging to launch conversations and action about ways to help students of color feel more valued on campus. The MCLA BEACON cited Pulse findings that showed "just 3% of these students say they strongly agree they feel valued by the college... The survey also showed 21% of white students strongly agree that they felt valued by MCLA." MCLA followed up the survey with panel discussions, student interviews, and department dialogues to promote continued conversation around what the results mean for equity and inclusion and to further examine the experience of students of color at MCLA.

Aggregate results from approximately 120,000 U.S. students are summarized in a recently released report--The COVID Pivot and Quality of the Undergraduate Experience: NSSE Pulse Project Report--that provides perspectives on how students and institutions navigated the pandemic. The eight headline-level findings featured below are elaborated in the report.

  1. The semester was tough, but most students evaluated their overall educational experience positively.
  2. A majority of students said their institution supported their academic success. Yet 1 in 3 students experienced low levels of academic support.
  3. Sufficient study space was a challenge for many remote learners. Students who were trying to study in noisy or distracting environments appreciated when their institution made classrooms and other spaces available.
  4. Students rated their quality of interactions with advisors the highest, followed by faculty and other students.
  5. Despite physical distancing requirements and shifts to remote instruction, students' sense of belonging--an expression of their connection to the institution and feeling valued--was strong.
  6. Student satisfaction with Internet access was lowest among students living on campus.
  7. The small share of students (about 7%) experiencing mostly in-person instruction had more favorable learning experiences (85% indicating an excellent or good overall educational experience) than those in mostly remote or hybrid courses.
  8. Students largely believed their institution helped keep them safe and healthy. However, despite required adjustments to remain compliant and safe, about 50% of students reported concerns that peers were not complying with institutions' health policies.

Generally, institutions and students managed reasonably well in fall 2020 despite dramatically changed circumstances. Open-ended comments affirmed that students appreciated being able to continue their education despite these changes. Students were more critical of unclear communications about how the pandemic would affect course availability, faculty furloughs, academic calendars, and the status of residence and dining facilities. In addition, students expressed stress and fear of potential burnout with new calendars and no breaks. Many students noted the need for access to counseling and other mental health services to ensure their well-being, and some indicated greater needs given pandemic stressors.

Students also felt support for their academic success and overall well-being. Students' sense of belonging results were not much different than pre-pandemic levels, with an understandable reduction in students reporting that they feel a part of the community at the institution. Overall, findings suggest that institutions were responsive to students' needs during the fall.

Although NSSE Pulse aggregate results provide insight on the undergraduate experience broadly, there is more to be gained by examining results at the institution level. Disaggregating results by factors such as course modality, residence, and student characteristics is particularly useful, as this is where significant and sometimes worrisome variations exist and the results help point to the need for targeted investigation and intervention.

  • Annual Results
  • Publications & Presentations
  • NSSE Essentials
  • NSSE Sightings (blog)
    • Search Posts

Evidence-Based Improvement in Higher Education resources and social media channels

  • Twitter
  • LinkedIn
  • Facebook
  • Instagram
  • YouTube

RELATED SITES

  • Center for Postsecondary Research
  • Indiana University Bloomington School of Education

Evidence-Based Improvement in Higher Education

Center for Postsecondary Research
Indiana University School of Education
201 N. Rose Avenue
Bloomington, IN 47405-1006
Phone: 812.856.5824
Contact Us


NSSE, FSSE, BCSSE, and the column logo are registered with the U.S. Patent and Trademark Office.
Accessibility | Privacy Notice | Copyright © 2021 The Trustees of Indiana University

Center for Postsecondary Research | Indiana University Bloomington School of Education