SPSS Syntax: Time Spent by Related-Major Category
Excel Graphing Template: Time Spent Graphing Template
Understanding how students allocate their time among academic work, employment, and other activities and commitments
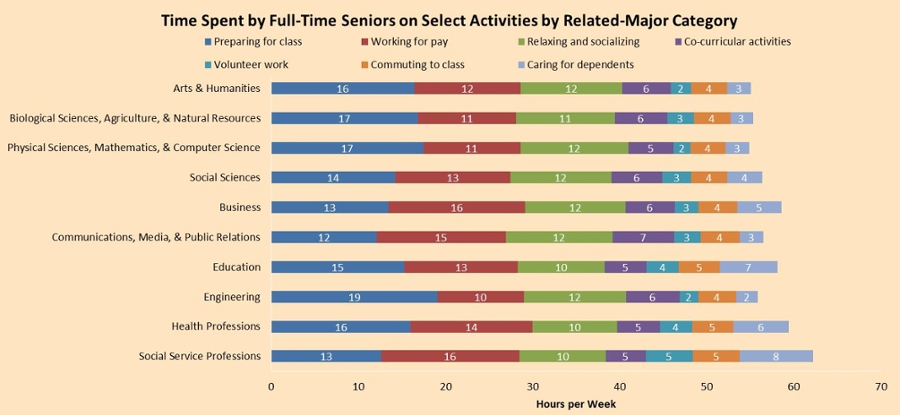
The figure below shows the average amount of time full-time seniors in NSSE 2014 spent on seven activities across ten categories of related majors (hours per week are estimated using the midpoint from the categorical response options). While seniors in different related-major categories spent their time in similar ways across a few activities (relaxing or socializing, co-curricular activities, and community service or volunteer work), they varied greatly in time spent preparing for class, ranging from 12 hours per week for communications, media, and public relations majors to 19 hours per week for engineering majors. Institutional users can reproduce this analysis using the SPSS syntax file to produce the average amount of time seniors spent on various activities and input these numbers into the Excel graphing template to produce the graph below.

For more information on these results and other ideas for connecting NSSE results to specific campus programs and units, see Lessons from the Field and the 2011 NSSE Annual Results. See NSSE's ten related-major categories for a list of individual majors within each category.

