Data Toolkit

A NSSE Data User's Guide: Sense of Belonging

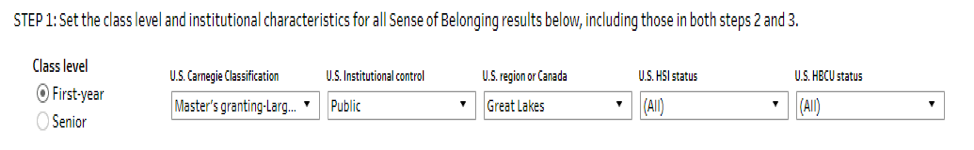
In 2020, NSSE added a trio of items to assess students' sense of belonging:

To what extent do you agree or disagree with the following statements? 
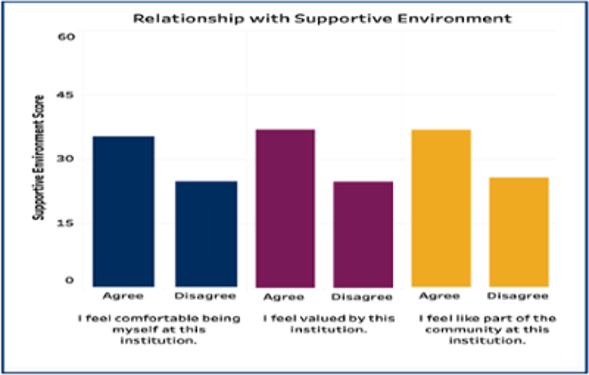
  a. I feel comfortable being myself at this institution.
  b. I feel valued by this institution.
  c. I feel like part of the community at this institution.
(Response options: Strongly agree, Agree, Disagree, Strongly disagree)

Sense of belonging is an important addition to the assessment of student engagement given its demonstrated relationship to student persistence, engagement, and development.

In this guide, we highlight approaches for institutions to examine their data about sense of belonging and, in particular, variation in belongingness by student background, and to consider how results can inform institutional action for improvement.

Step 3. Relate belonging results to other measures of student engagement and success

  • How do the sense of belonging results relate to your Engagement Indicators? Statistical tests can be run, but what is the overall pattern? For example, do you notice high first year student belonging and also high student faculty interaction scores?
  • Major is important to consider for seniors. What patterns do you notice in your Major Field Report results? Perhaps, physical science majors have a high sense of belonging and also have high student faculty engagement scores.
  • Identify academic programs where students have a high sense of belonging. In what ways could they teach academic programs with low sense of belonging to increase belonging among majors?
  • What do you notice about sense of belonging and students’ intent to return or overall satisfaction results? Add retention data to your datafile to test the relationship between sense of belonging and persistence

Are you ready to continue digging into your NSSE sense of belonging results? We encourage you to view our December 2020 webinar, Do Your Students Feel They Belong? Examining Sense of Belonging and Engagement, to learn more about your data.

Access the Sense of Belonging Tableau dashboard to see how institutions like yours compare on sense of belonging. Learn more about the dashboard in the section below.

View the webinar and slides —Do Your Students Feel They Belong? Examining Sense of Belonging and Engagement, with Jillian Kinzie, Allison BrckaLorenz and Colleen Lofton.

Using the Sense of Belonging Interactive Data Display

NSSE created a public Sense of Belonging interactive data display in Tableau to support the investigation of sense of belonging results and to provide institutions the opportunity to explore aggregate results by institutional and student characteristics of interest. The dashboard allows users to create similar peer groups by selecting institutional categories of Carnegie Classification, control, region or Canada, and MSI status, and filtering by a range of student characteristics, such as major, gender identity, racial/ethnic identity, enrollment status, etc. Using these selections, institutions can create more finely tailored groups to explore assessment questions and in particular, for comparative analysis. In addition, the “Download” feature allows you to save and share your results.

A Great Lakes University (GLU) implemented a redesigned first-year seminar program organized by “meta-majors” to help students learn about their major, make connections to an academic department, and be with likeminded peers. They want to know if the program is facilitating students’ sense of belonging.

class level and institutional characteristic for all sense of belonging resluts

Results showing, for example that GLU had a higher overall first-year student belonging scale score and an individual item percentage positive difference of 5% in comparison to the peer group might be an early indicator that the meta-major FY seminars are making a difference to belonging.

GLU could also take a deeper dive by refining dashboard comparison results and exploring more student characteristics of interest. For example, restricting major field categories to only include majors represented at the University and filtering results for first-generation students to assess the impact of the new seminars on these students who have historically been less connected to the institution and may benefit more from the personalized attention of the seminars, could provide quick insight into program benefit and suggest where additional assessment may be undertaken.

By using NSSE’s Sense of Belonging dashboard, institutions can filter to develop more refined comparison results for the sense of belonging scale scores and individual items to contextualize their results.