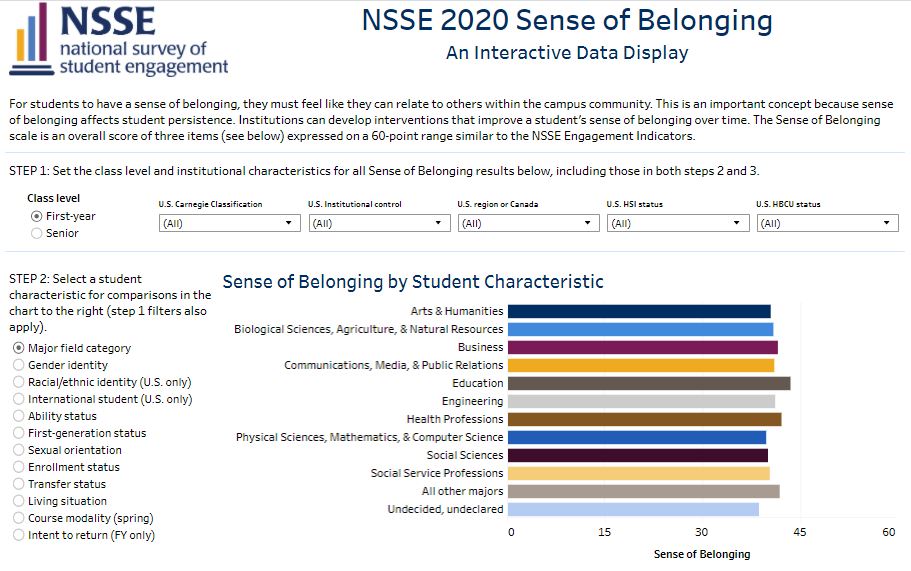
Want to explore NSSE or FSSE data on your own? In addition to the NSSE Report Builder, NSSE & FSSE staff have developed several public interactive data displays using Tableau. Visit our latest dashboards to see how institutions like yours compare relative to other institutions, or to query by student characteristics. More dashboards are in development – stay tuned! In the meantime, be sure to leverage the “download” feature to save and share your results.
- NSSE Sense of Belonging
Accompanies the Building Community for All story in the Engagement Insights–Annual Results 2020 - NSSE–The LRCs of Advising
Accompanies the advising story in the Engagement Insights–Annual Results 2020 - FSSE Sense of Belonging & Teaching Environment
Accompanies the Faculty Insights story in the Engagement Insights–Annual Results 2020 - FSSE Interactive Reports
Visit FSSE’s full collection of dashboards!


