Pandemic & Student Engagement

The Pandemic and Student Engagement: Trends, Disparities, and Opportunities

After the sudden shift to online instruction in spring 2020, colleges and universities faced a daunting task for the 2020-2021 academic year: to continue teaching and campus activities in the safest but least disruptive way possible, while confronting even greater uncertainty as the pandemic continued to unfold. In planning the 2021 survey administration, NSSE recognized the need to address these challenges and their impact on students. Two ways we sought to accommodate these shifts were to revise an existing survey question about course modality and the development of a topical module focused specifically on the challenges and adaptations resulting from the pandemic: Coping with COVID. Questions from the module focus on topics such as faculty and institutional responsiveness, disrupted educational plans, stressors and negative emotional experiences, and changes in activities and time demands.

I have enjoyed meeting people in my Living Learning Community, but COVID restrictions, although they are necessary, have caused some difficulties for me in making friends and connections.

FIRST-YEAR STUDENT, PSYCHOLOGY MAJOR

Dramatic Shifts in Course Modality

Results from the new course modality question are striking. Although direct comparisons to prior years cannot be made, until 2021 relatively few students took all courses online in the spring—for example, in 2019, only 8% of first-years and 20% of seniors took all spring courses online. In 2021, however, fully 65% of first-year students took mostly remote courses, while 16% took mostly hybrid, and 12% took a balanced mix of modalities. Just 7% of said their courses were mostly in-person! For seniors, 66% of courses were mostly remote, 13% hybrid, and 10% a balanced mix, while only 11% were mostly in-person (Figure 1).

Figure 1. What Types of Courses Have You Taken This Year?Go to an accessible version of this figure: What Types of Courses Have You Taken This Year?

Note: NSSE 2021 results in figure 1 are from 154,653 first-year and senior students at 337 U.S. bachelor's degree-granting institutions.

These patterns varied somewhat depending on the type of student and institution. Students at doctorate-granting universities were more likely to take most courses online, whereas students at baccalaureate-level institutions were more likely to take most courses in-person or in a hybrid format. Nontraditionally aged students (21 and older for first-years; 25 and older for seniors) were much more likely to take mostly remote courses. While on-campus residents were more likely to have in-person courses, it is noteworthy that 47% of first-years and 44% of seniors who lived on campus had mostly remote courses.

More Features

An image of the cover slide of the webinar entitled "Covid Times and Student Engagement: Using and Interpreting NSSE 2021 Results". Image includes the NSSE logo, names of presenters, and images of students and faculty in learning situations.

NSSE 2021 in Context: COVID Impact

As many schools adapted to remote instruction, participation in some HIPs declined and students had fewer opportunities for collaborative learning and faculty interaction. This Enews story also links to a Webinar on the subject.

Visit the Enews story
two students studying together on the lawn in front of a limestone building at Illinois Wesleyan University

Mental Health and Academic Difficulty: BCSSE Findings

Time to check in with our first-year students? COVID-induced distance learning challenged their final year of high school. How might we expect their engagement to be affected?

Visit the BCSSE story

Age-Related Differences in the Student Experience

Table 3. Pandemic Interference by Age Group
To what extent, if any, has the COVID-19 pandemic interfered with the following?First-year traditional ageFirst-year nontrad. ageSenior traditional ageSenior nontrad. age
Your college plans55%39%49%35%
Your ability to succeed as a student43%36%41%30%
Your plans to participate in special learning opportunities57%36%60%40%
Your ability to pay for college and living expenses33%37%36%36%
Your preferred living situation37%30%33%25%

Note: Percentages are the sum of "very much" and "quite a bit." Nontraditional age is defined as 21 and older for FY students and 25 and older for seniors.


Figure 3. As a Result of the COVID-19 Pandemic, To What Extent, If Any, Has Your Concern About the Following Increased? Results for First-Year Students by Age GroupGo to an accessible version of this figure: To What Extent, If Any, Has Your Concern About the Following Increased?

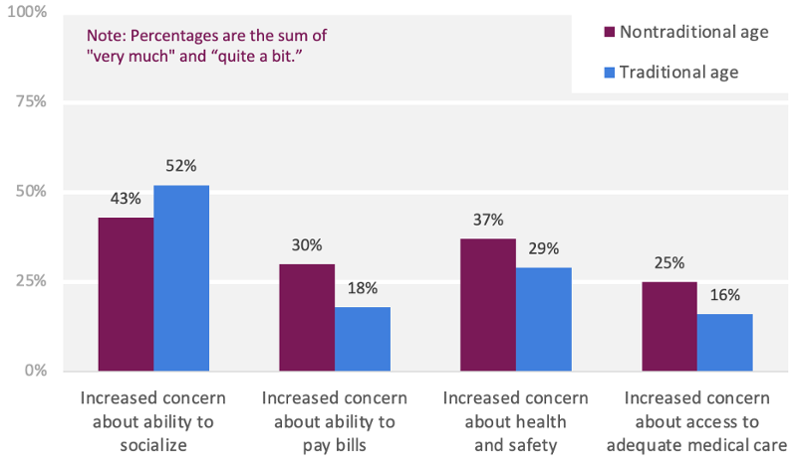
Some differences were observed for nontraditional-age students (21 and older for first-years; 25 and older for seniors), compared with their traditional-age counterparts. Given the variation in course modality for these groups, this is understandable, but further investigating discrepancies can help to reveal opportunities for customized support aligned with the needs of the group. Both first-year and senior traditional-age students were more likely to feel that the pandemic interfered with their college plans, ability to succeed as a student, ability to participate in special learning opportunities, and preferred living situation (Table 3). These traditional-age students were also more likely to struggle with increased mental health issues, including feeling hopeless, inability to concentrate, and difficulty sleeping, as well as increased concern (“quite a bit” or “very much”) about their ability to socialize. It may be that traditional-age students had higher or more developed expectations about the changes that college would bring (i.e., living away from home, freedoms), but given pandemic shifts in course modality and social life not all of these experiences were possible. In comparison, nontraditional-age students may have better tempered their expectations or could be more resilient and have better coping strategies than their younger counterparts. Meanwhile, first-year nontraditional-age students were more likely to feel increased concern about their ability to pay bills, health and safety, and access to adequate medical care (Figure 3).  Not surprisingly, both first-year (33%) and senior (36%) nontraditional-aged students were more likely to substantially (“more” and “much more”) increase their time spent caring for dependents and others, compared to 17% (first-years) and 19% (seniors) of traditional-aged students.


Note: In the results above, all core item percentages are weighted by institution-reported sex, enrollment status, and institutional size. All module item percentages are weighted by institution-reported sex and enrollment status.

How Engagement Shifted During the Pandemic

Given the widespread adoption of online learning during the 2020-21 academic year as well as the tumult—both organizational and personal—caused by the pandemic, it comes as no surprise that certain forms of student engagement shifted from prior years at many institutions. What is surprising is that only a few engagement measures declined substantially. 

Figures 4-7 are featured in the slideshow below.

Figure 4. Distribution of Institution-Level Differences in First-Year Engagement Between 2021 and Prior Years, by Engagement IndicatorGo to an accessible version of figure 4: Distribution of Institution-Level Differences in First-Year Engagement Between 2021 and Prior Years, by Engagement Indicator
Figure 5. Distribution of Institution-Level Differences in Seniors' Engagement Between 2021 and Prior Years, by Engagement IndicatorGo to an accessible version of figure 5: Distribution of Institution-Level Differences in Seniors' Engagement Between 2021 and Prior Years, by Engagement Indicator
Figure 6. Distribution of Institution-Level Differences in First-year High-Impact Practice Participation Between 2021 and Prior Years, by High-Impact PracticeGo to an accessible version of figure 6: Distribution of Institution-Level Differences in First-year High-Impact Practice Participation Between 2021 and Prior Years, by High-Impact Practice
Figure 7. Distribution of Institution-Level Differences in Seniors' High-Impact Practice Participation Between 2021 and Prior Years, by High-Impact PracticeGo to an accessible version of figure 7: Distribution of Institution-Level Differences in Seniors' High-Impact Practice Participation Between 2021 and Prior Years, by High-Impact Practice
Note: The figures in the slideshow above present distributions of standardized difference scores. Negative values reflect a decrease in Engagement Indicator scores or HIP participation rates from 2018 or 2019 to 2021.  

We used information from more than 200,000 first-year and senior respondents at 296 institutions to shed light on whether and how engagement was affected. The institutions included in this analysis participated in NSSE 2021 and at least one recent administration other than 2020 (2018 or 20191).

We examined NSSE’s 10 Engagement Indicators (EI) and six High-Impact Practices (HIP), as shown in the slideshow for Figures 4 to 7. For each Engagement Indicator, we calculated a standardized difference (effect size) using 2021 and prior year data for first-year and senior respondents at each institution; negative scores indicate that engagement decreased in 2021. Reviewing the distribution of institution-level difference scores for each EI leads to several conclusions.2 Most notably, forms of student engagement that have historically relied on face-to-face interactions or accessing services and attending events, including Collaborative Learning, Discussions with Diverse Others, Student-Faculty Interaction, and Supportive Environment, declined at many institutions. While approximately half of institutions saw a 0.5 standard deviation or more decrease in first-year Collaborative Learning scores, the other measures showed more modest shifts (median declines of 0.14 to 0.20 standard deviations).

In contrast, six EIs tended not to decrease substantially, including Higher-Order Learning, Reflective & Integrative Learning, Quantitative Reasoning, Learning Strategies, Effective Teaching Practices, and Quality of Interactions. In fact, many institutions scored slightly higher on these measures in 2021, regardless of class level. Though a comparison of results between class levels shows similar difference score distributions, Collaborative Learning and Supportive Environment appeared to decline more for first-year students than for seniors, suggesting that seniors may have weathered pandemic-related obstacles by relying on their pre-pandemic support networks and awareness of campus resources.


"The most significant learning experience I have had is the shift to online learning during the pandemic. This was a shift for everyone at my school and we all joined together to learn how to handle things and do things differently. It was a big learning experience to become educated on how to work through online courses and learn a new way of being in a class. Overall, it provided a sense of community because everyone was in it together (faculty, students, staff), learning how to do things differently."

SENIOR, ART MAJOR, WHEATON COLLEGE (MA)


We analyzed HIP participation rates using standardized difference scores to assess the extent of change as well, but using different effect size evaluative criteria for four of the six practices.3 In the aggregate, most HIP participation rates declined in trivial or modest ways in 2021. The median effect sizes for first-year and senior students all indicated small declines in participation rates, with standardized difference scores averaging about –0.08; a review of 25th percentile scores indicated slightly greater decline but still within the range of small effect sizes. First-year participation in service-learning as well as senior participation internships and study abroad showed the strongest relative decline of all HIPs with approximately 25% of institutions showing standardized difference scores of –0.30, -0.22, and –0.25 or less, respectively. A small number of institutions saw increases in HIP participation, but for the vast majority of these the shift was small or trivial in size.

Overall, the pandemic resulted in fairly predictable changes to student engagement from prior years. Students, faculty, and staff have persevered, finding ways to be engaged remotely or in hybrid modes and to take advantage of pandemic-altered opportunities for learning. We encourage institutions to examine where their results diverge from our comparative analysis to enhance the interpretation of institution-level engagement trends.


Notes:
1. Despite NSSE 2020 institutional results being mostly unaffected by the pandemic, we chose to use earlier administration data to err on the side of caution given the baseline’s importance for measuring change.
2. To assess the magnitude of Engagement Indicator changes, differences greater than .1, .3, and .5 are considered small, medium, and large, respectively. For service-learning, internships, study abroad, and culminating senior experiences, an effect size of about .2 may be considered small, .5 medium, and .8 large. For learning community and research with faculty, .1 may be considered small, .3 medium, and .5 large (Rocconi & Gonyea, 2018).
3. For first-year students, we only analyze participation in three HIPs that are likely to be experienced during the first-year of college: learning community, service-learning, and research with faculty.